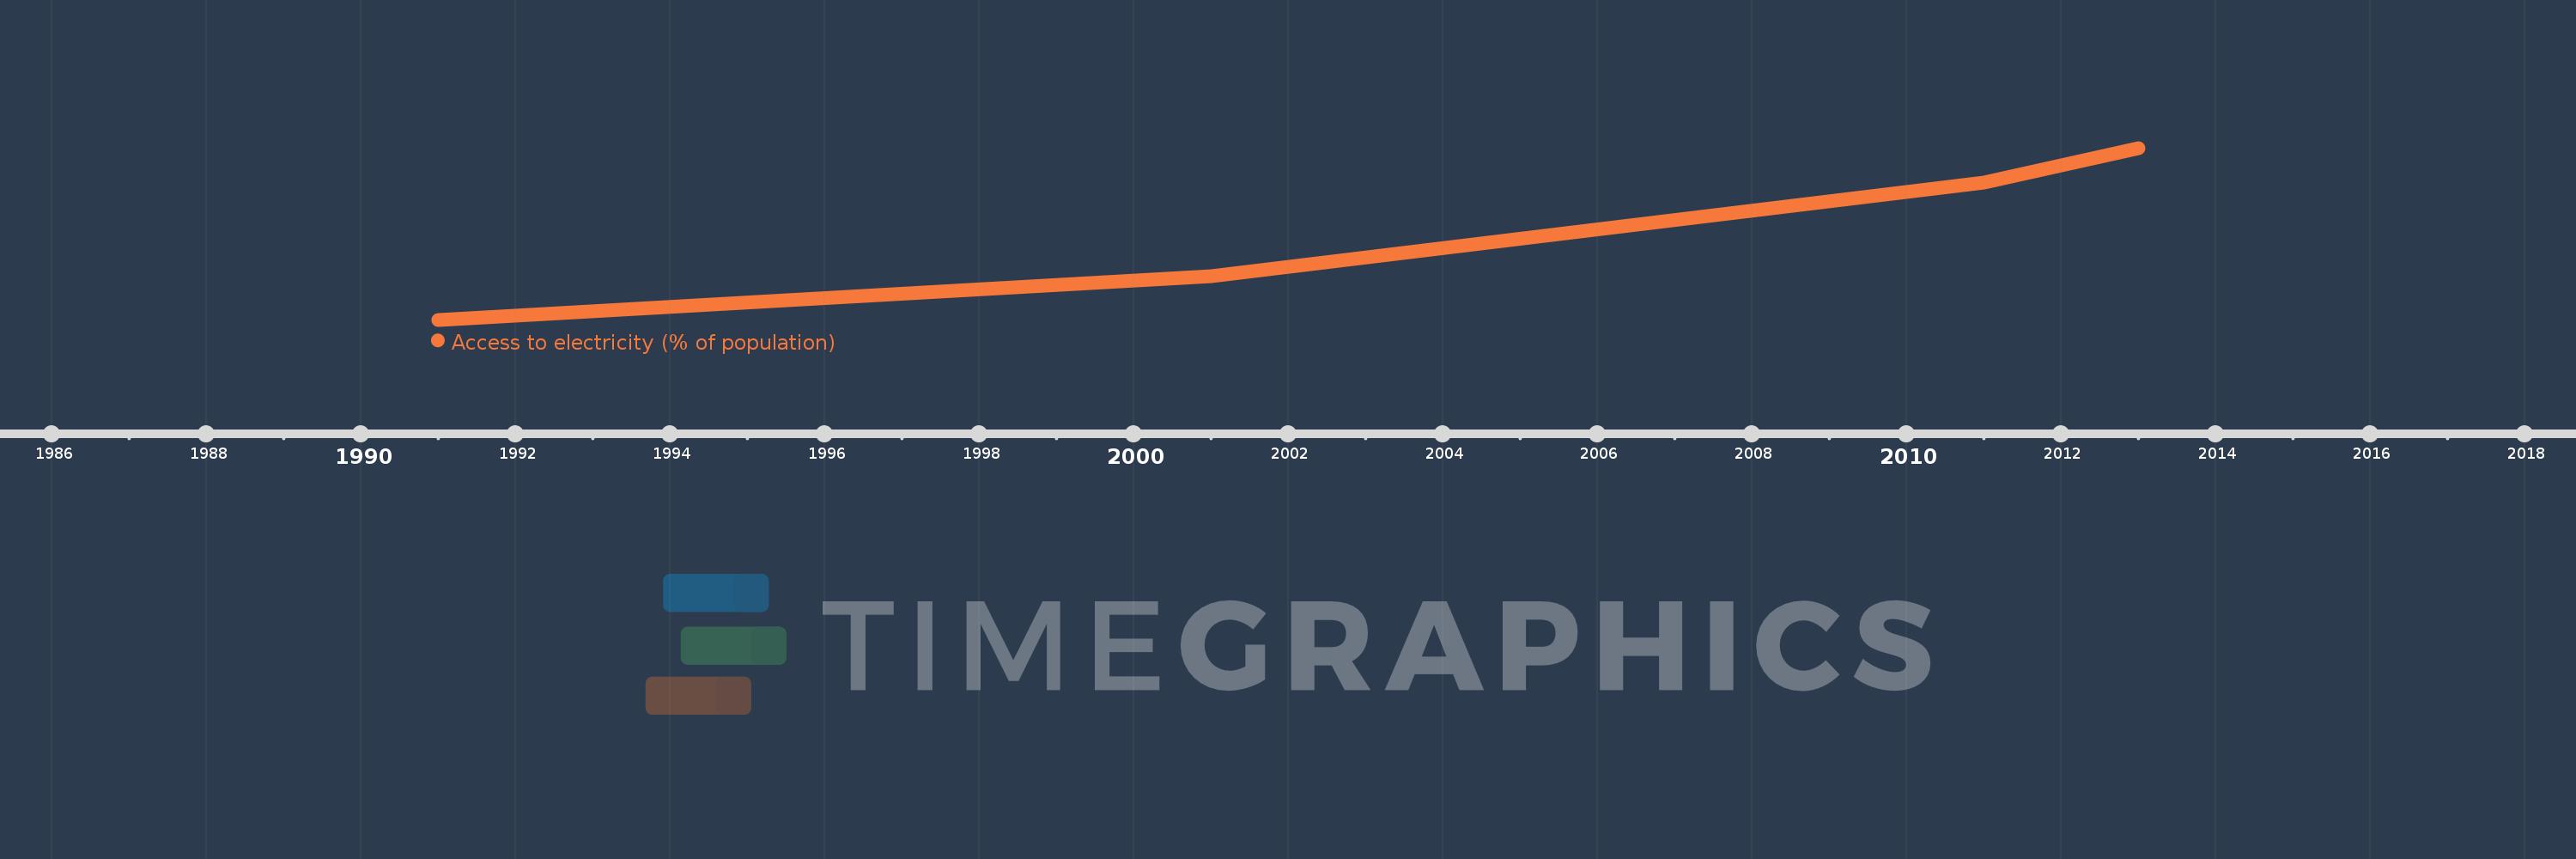
This timeline shows a graph from 1991 to 2013 of Least developed countries: UN classification. No data until 1990. Number of actual observations by date: 4.
Source name:
World Development Indicators
Source organization:
World Bank, Sustainable Energy for All (SE4ALL) database from World Bank, Global Electrification database.
Categories, topics:
Energy & Mining, Climate Change, Environment
Last updated:
apr 23, 2017
Indicators value changes by year
Meaning:
27.308
Minimum:
19.878
jan 1, 1991
Maximum:
34.337
jan 1, 2013
At the date of observation
Value
Absolute change
Change from the previous value
jan 1, 1991
19.878
+19.878
0.0%
jan 1, 2001
23.579
+3.701
18.62%
jan 1, 2011
31.435
+7.856
33.32%
jan 1, 2013
34.337
+2.902
9.23%
Ranking of countries by current statistics by years