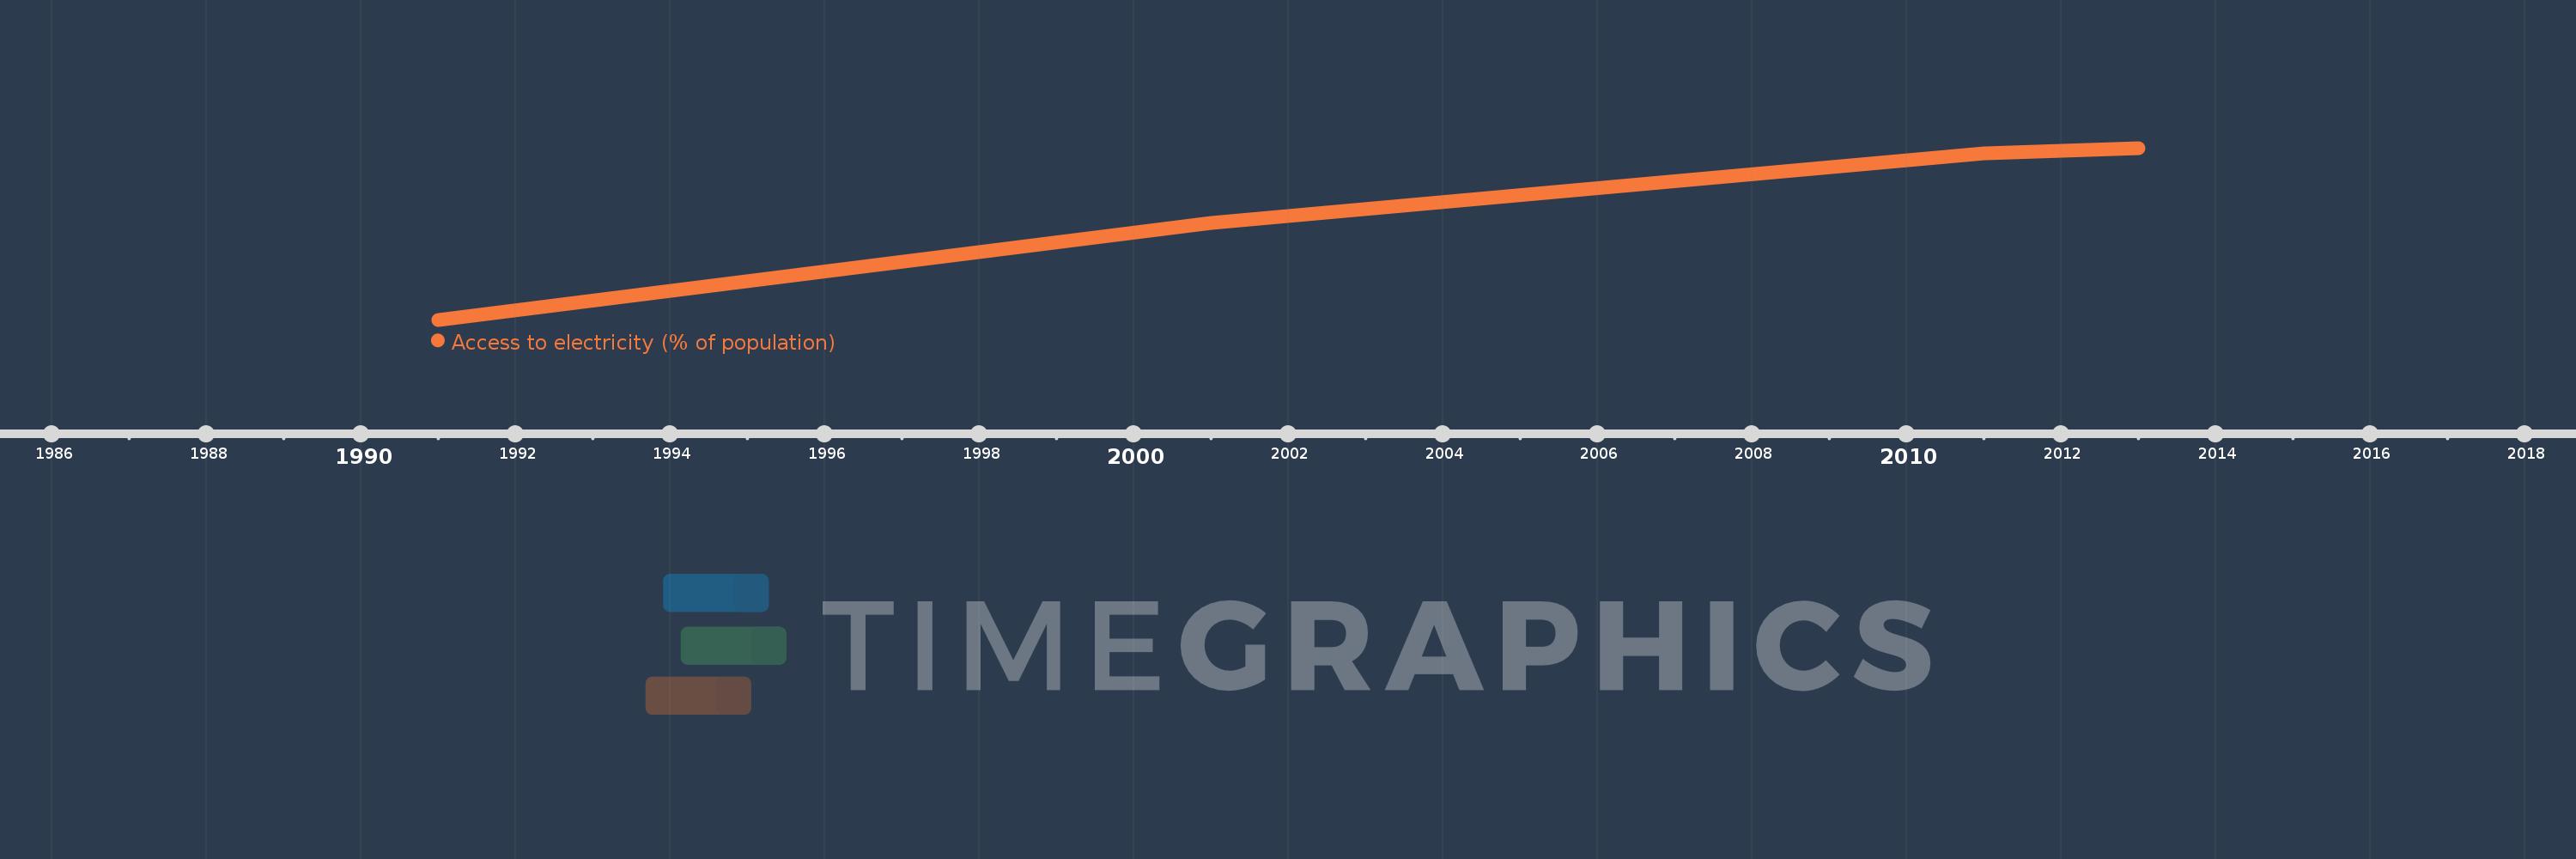
This timeline shows a graph from 1991 to 2013 of Europe & Central Asia (IDA & IBRD countries). No data until 1990. Number of actual observations by date: 4.
Source name:
World Development Indicators
Source organization:
World Bank, Sustainable Energy for All (SE4ALL) database from World Bank, Global Electrification database.
Categories, topics:
Energy & Mining, Climate Change, Environment
Last updated:
apr 23, 2017
Indicators value changes by year
Meaning:
99.391
Minimum:
98.341
jan 1, 1991
Maximum:
100.0
jan 1, 2013
At the date of observation
Value
Absolute change
Change from the previous value
jan 1, 1991
98.341
+98.341
0.0%
jan 1, 2001
99.274
+0.933
0.95%
jan 1, 2011
99.949
+0.675
0.68%
jan 1, 2013
100.0
+0.051
0.05%
Ranking of countries by current statistics by years