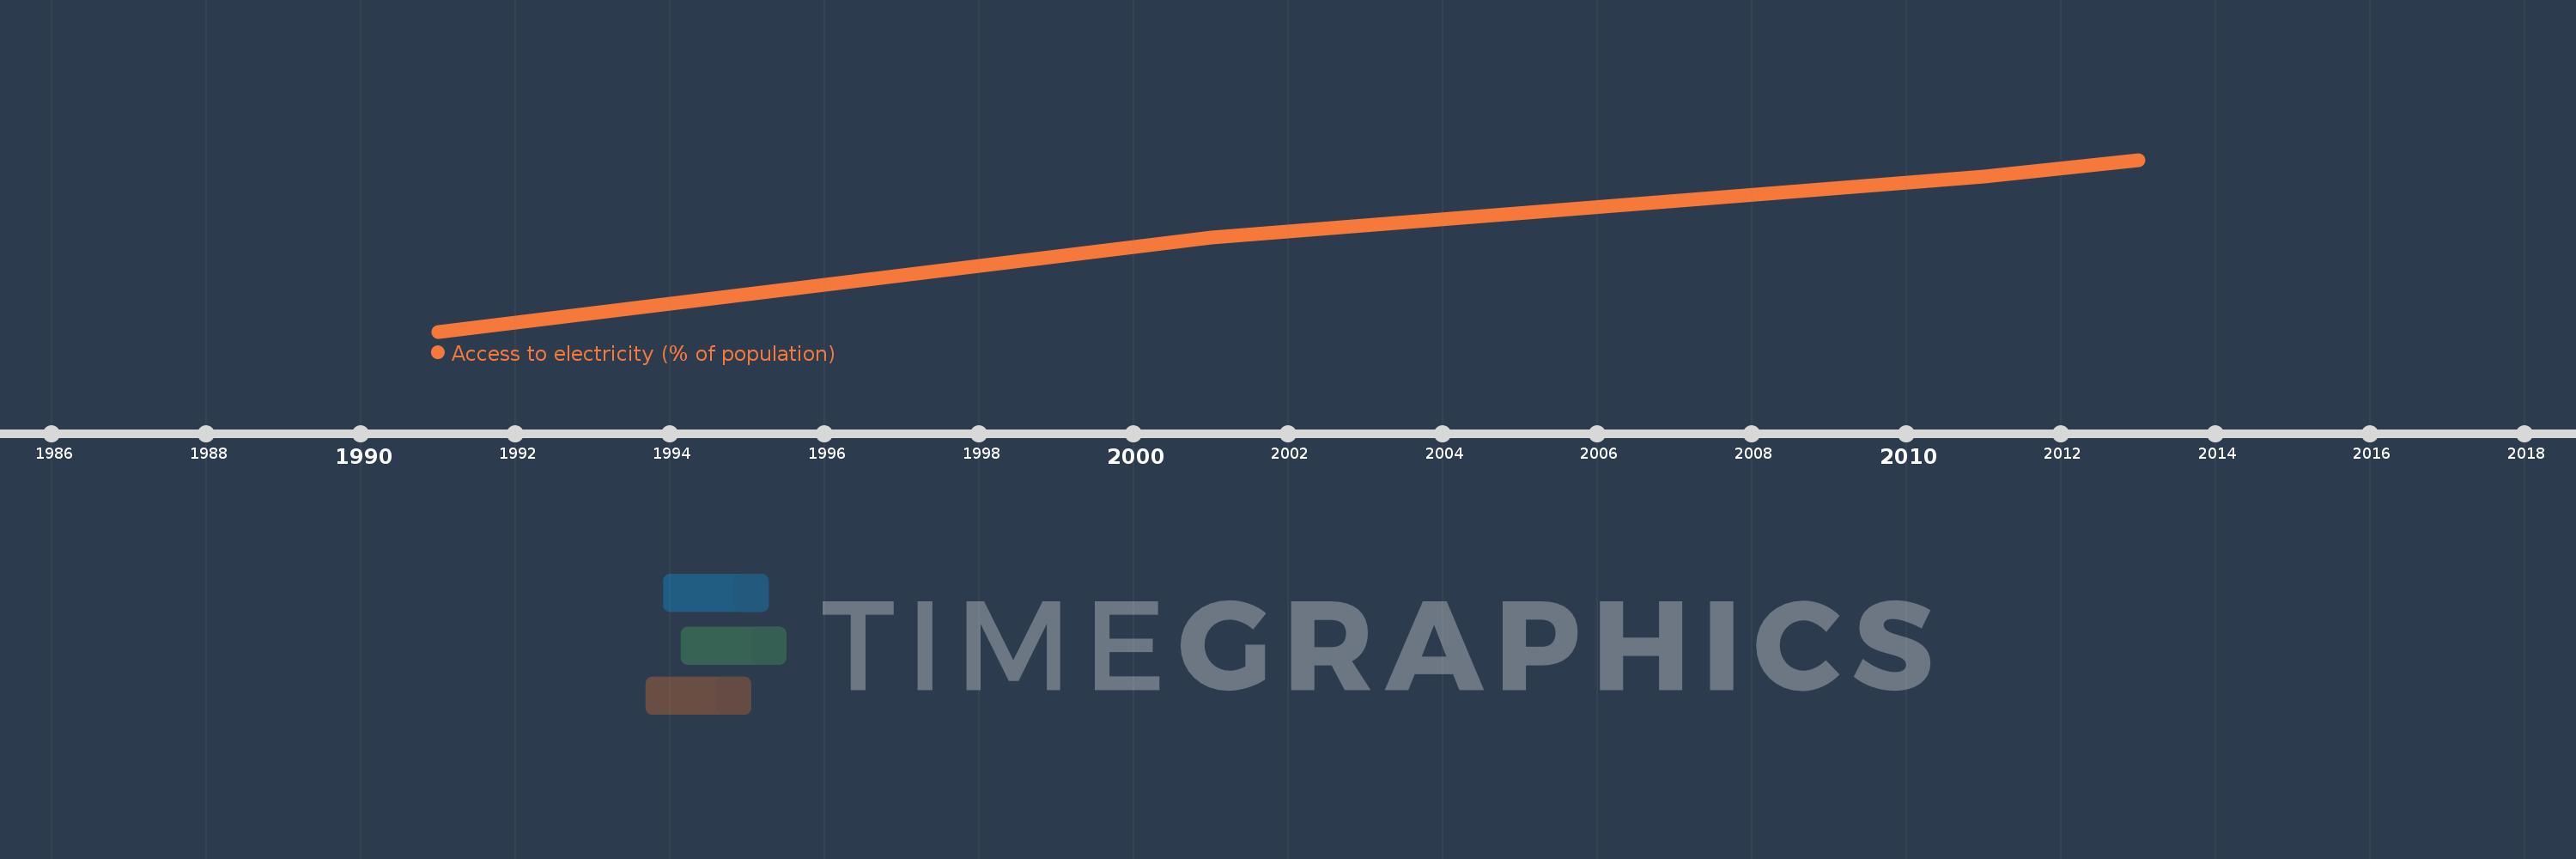
This timeline shows a graph from 1991 to 2013 of East Asia & Pacific (excluding high income). No data until 1990. Number of actual observations by date: 4.
Source name:
World Development Indicators
Source organization:
World Bank, Sustainable Energy for All (SE4ALL) database from World Bank, Global Electrification database.
Categories, topics:
Energy & Mining, Climate Change, Environment
Last updated:
apr 23, 2017
Indicators value changes by year
Meaning:
91.995
Minimum:
86.119
jan 1, 1991
Maximum:
95.714
jan 1, 2013
At the date of observation
Value
Absolute change
Change from the previous value
jan 1, 1991
86.119
+86.119
0.0%
jan 1, 2001
91.349
+5.23
6.07%
jan 1, 2011
94.8
+3.451
3.78%
jan 1, 2013
95.714
+0.914
0.96%
Ranking of countries by current statistics by years