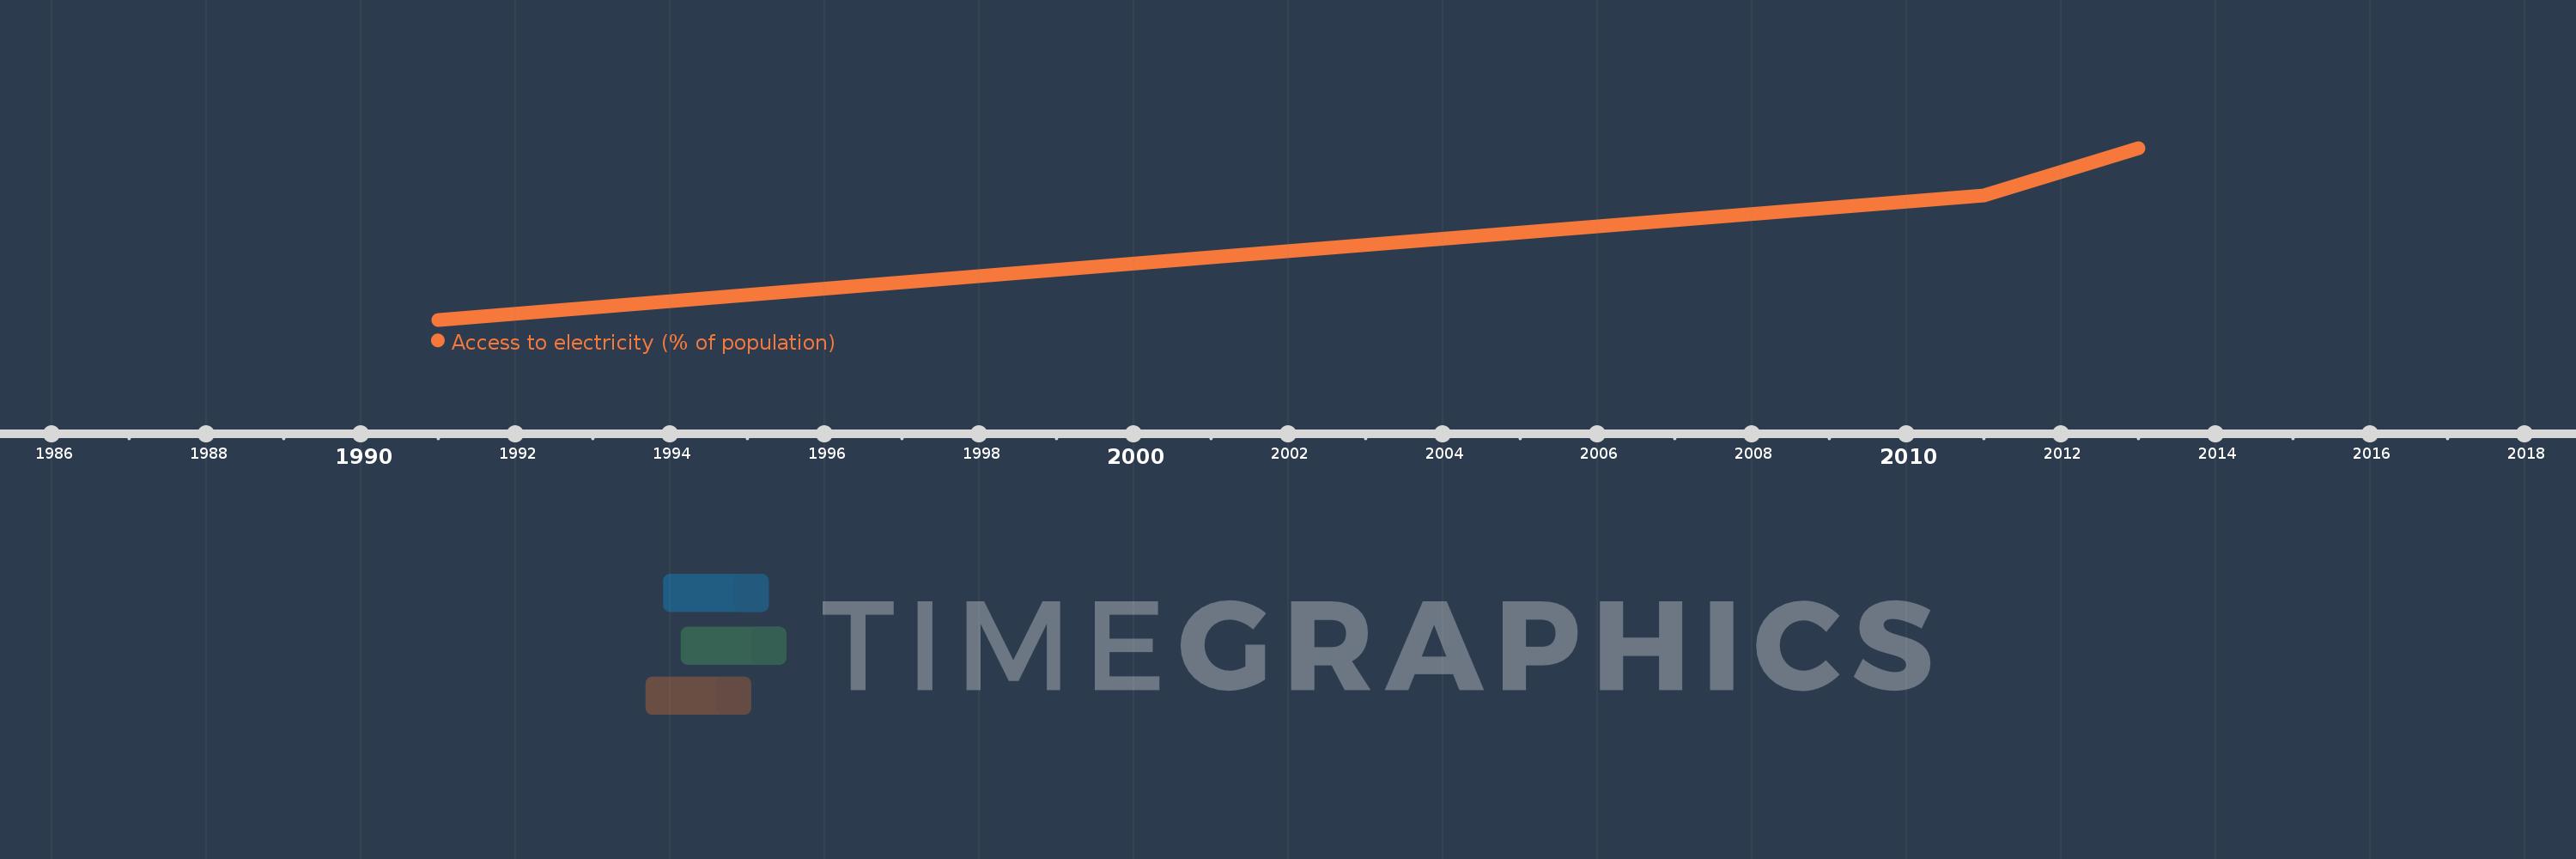
This timeline shows a graph from 1991 to 2013 of Fragile and conflict affected situations. No data until 1990. Number of actual observations by date: 4.
Source name:
World Development Indicators
Source organization:
World Bank, Sustainable Energy for All (SE4ALL) database from World Bank, Global Electrification database.
Categories, topics:
Energy & Mining, Climate Change, Environment
Last updated:
apr 23, 2017
Indicators value changes by year
Meaning:
37.882
Minimum:
33.53
jan 1, 1991
Maximum:
41.86
jan 1, 2013
At the date of observation
Value
Absolute change
Change from the previous value
jan 1, 1991
33.53
+33.53
0.0%
jan 1, 2001
36.565
+3.035
9.05%
jan 1, 2011
39.574
+3.009
8.23%
jan 1, 2013
41.86
+2.286
5.78%
Ranking of countries by current statistics by years