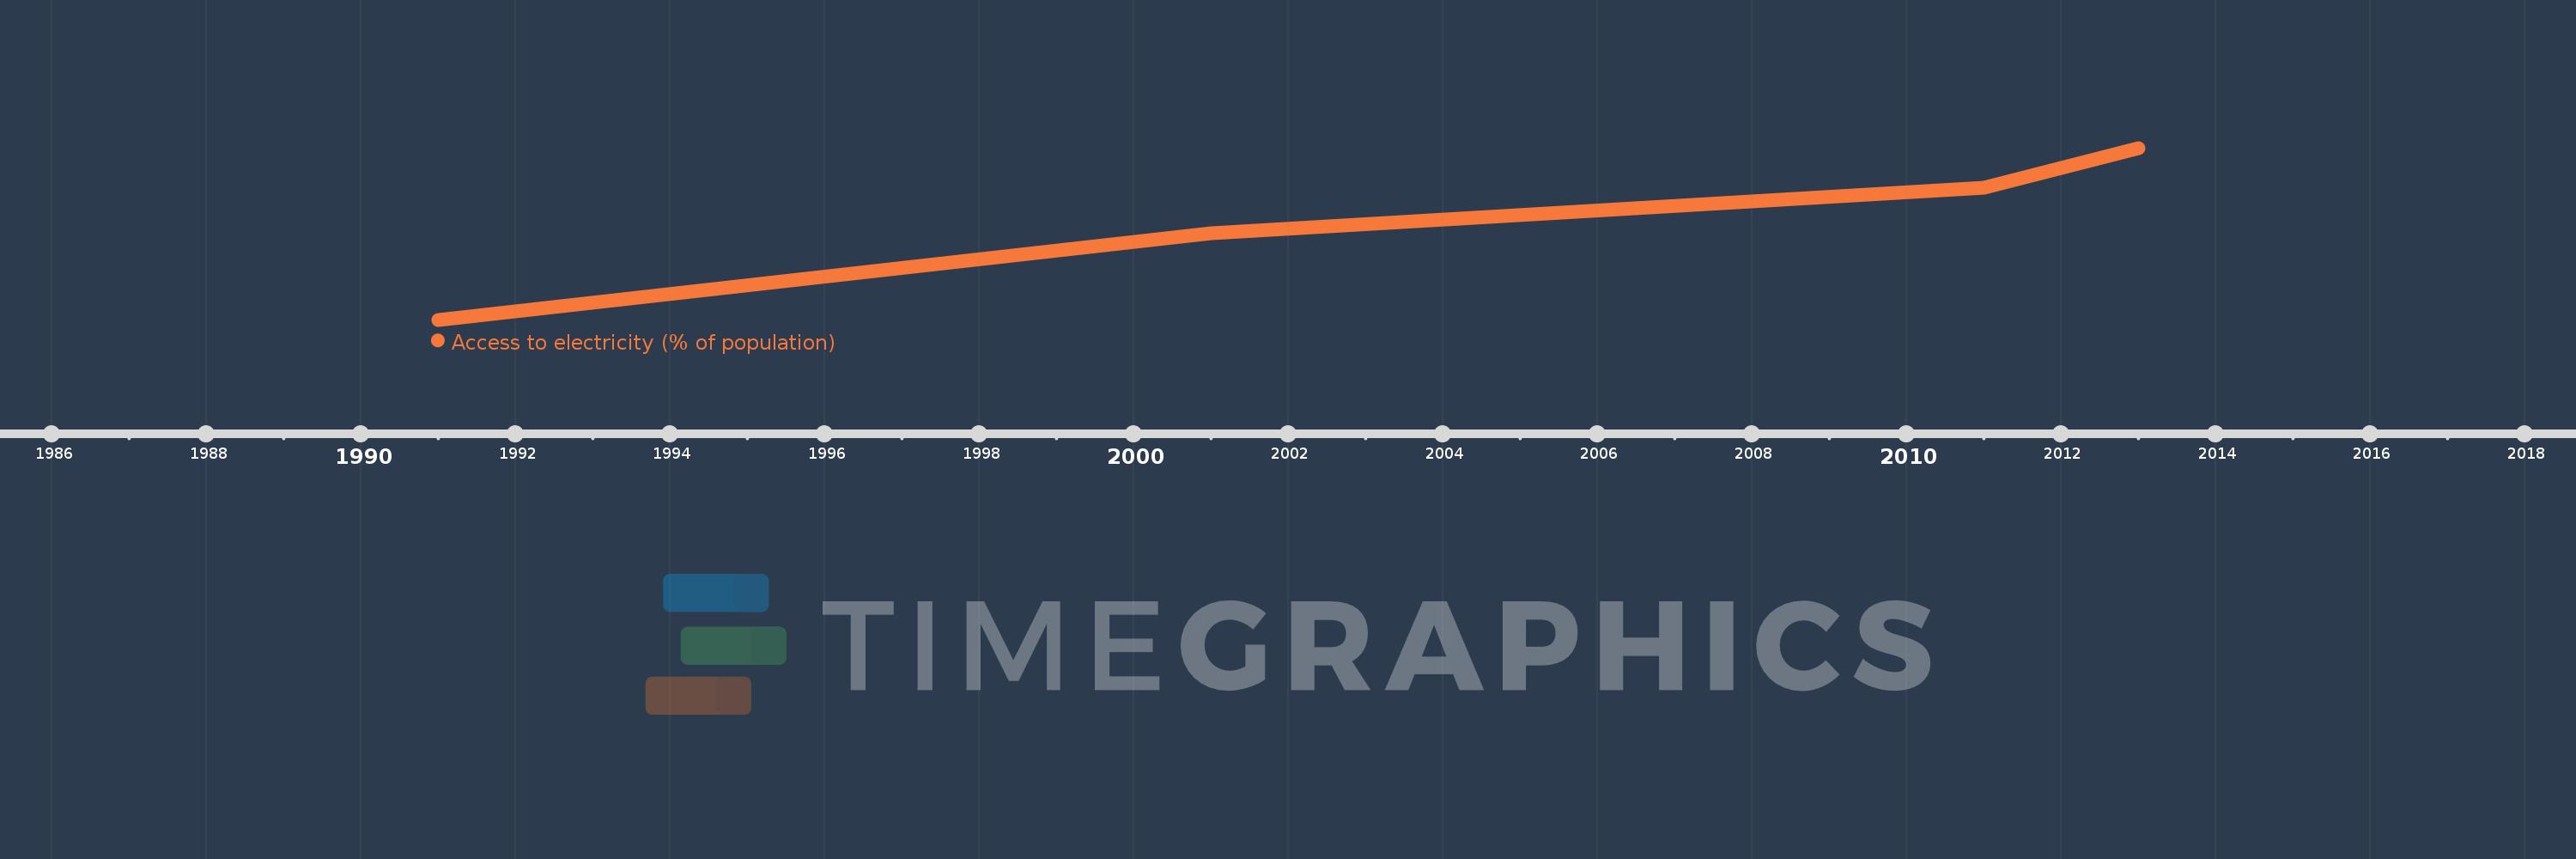
This timeline shows a graph from 1991 to 2013 of Latin America & the Caribbean (IDA & IBRD countries). No data until 1990. Number of actual observations by date: 4.
Source name:
World Development Indicators
Source organization:
World Bank, Sustainable Energy for All (SE4ALL) database from World Bank, Global Electrification database.
Categories, topics:
Energy & Mining, Climate Change, Environment
Last updated:
apr 23, 2017
Indicators value changes by year
Meaning:
93.218
Minimum:
89.045
jan 1, 1991
Maximum:
96.377
jan 1, 2013
At the date of observation
Value
Absolute change
Change from the previous value
jan 1, 1991
89.045
+89.045
0.0%
jan 1, 2001
92.754
+3.709
4.17%
jan 1, 2011
94.693
+1.939
2.09%
jan 1, 2013
96.377
+1.684
1.78%
Ranking of countries by current statistics by years