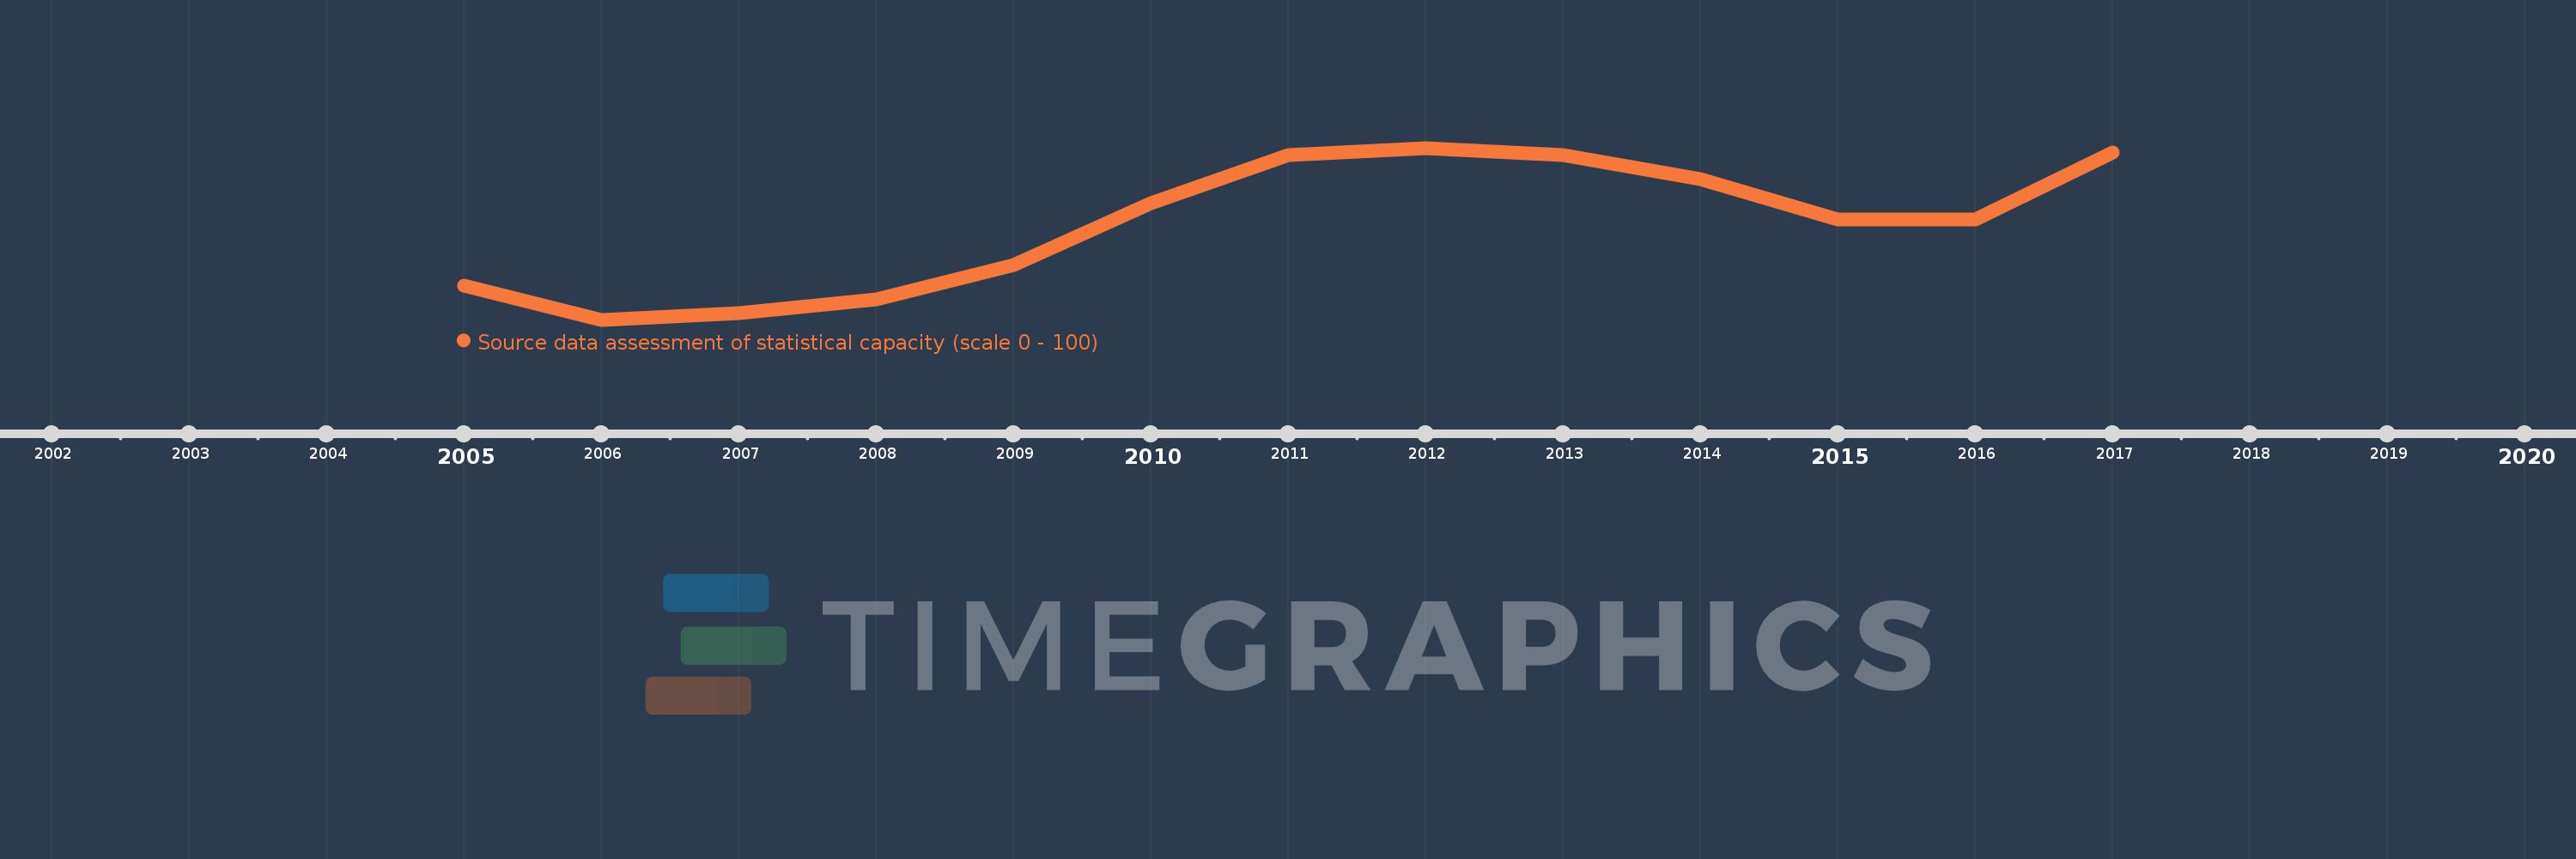
This timeline shows a graph from 2005 to 2017 of Sub-Saharan Africa (excluding high income). No data until 2004. Number of actual observations by date: 13.
Source name:
World Development Indicators
Source organization:
World Bank
Categories, topics:
Public Sector
Last updated:
apr 23, 2017
Indicators value changes by year
Meaning:
53.792
Minimum:
50.476
jan 1, 2006
Maximum:
56.429
jan 1, 2012
At the date of observation
Value
Absolute change
Change from the previous value
jan 1, 2005
51.667
+51.667
0.0%
jan 1, 2006
50.476
-1.19
-2.3%
jan 1, 2007
50.714
+0.238
0.47%
jan 1, 2008
51.19
+0.476
0.94%
jan 1, 2009
52.381
+1.19
2.33%
jan 1, 2010
54.524
+2.143
4.09%
jan 1, 2011
56.19
+1.667
3.06%
jan 1, 2012
56.429
+0.238
0.42%
jan 1, 2013
56.19
-0.238
-0.42%
jan 1, 2014
55.349
-0.842
-1.5%
jan 1, 2015
53.953
-1.395
-2.52%
jan 1, 2016
53.953
0.0
0.0%
jan 1, 2017
56.279
+2.326
4.31%
Ranking of countries by current statistics by years