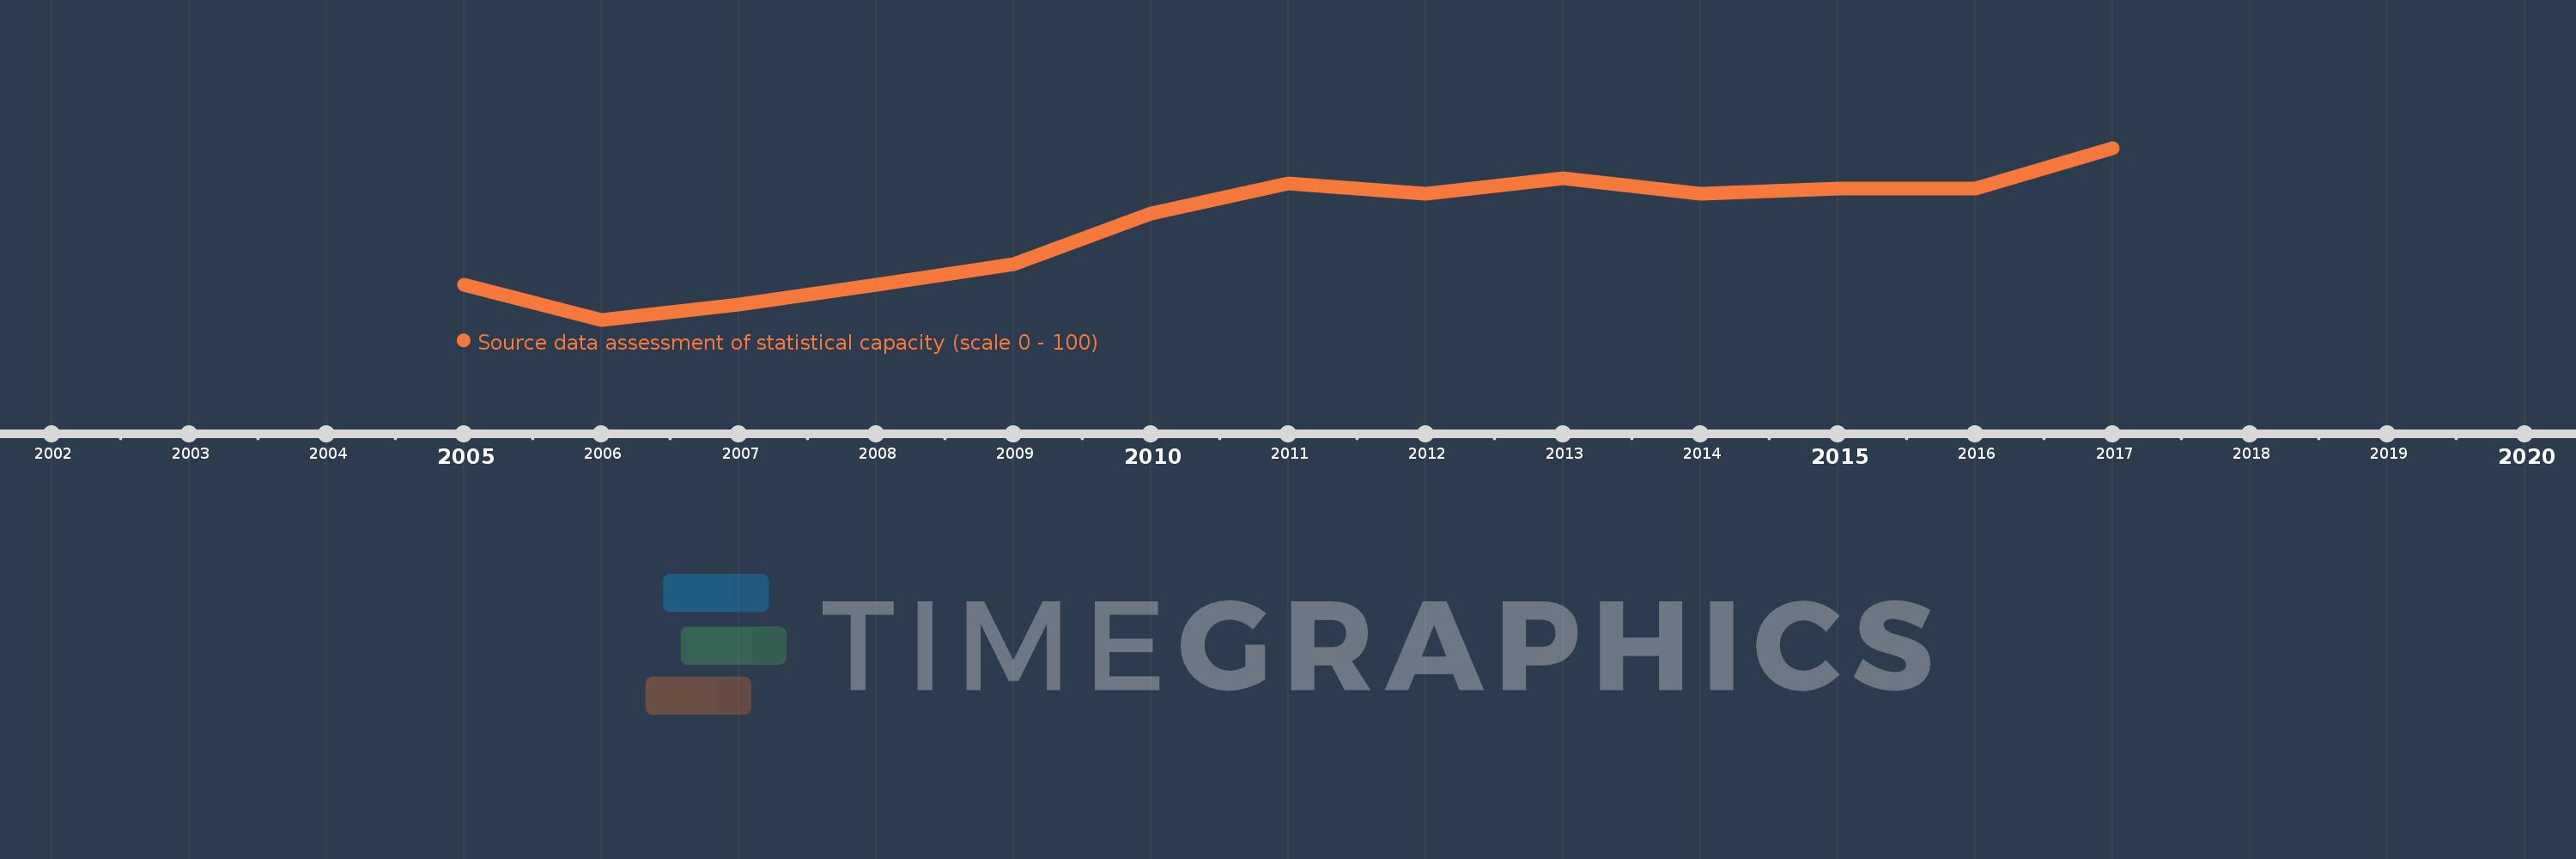
This timeline shows a graph from 2005 to 2017 of Heavily indebted poor countries (HIPC). No data until 2004. Number of actual observations by date: 13.
Source name:
World Development Indicators
Source organization:
World Bank
Categories, topics:
Public Sector
Last updated:
apr 23, 2017
Indicators value changes by year
Meaning:
53.184
Minimum:
48.056
jan 1, 2006
Maximum:
57.5
jan 1, 2017
At the date of observation
Value
Absolute change
Change from the previous value
jan 1, 2005
50.0
+50.0
0.0%
jan 1, 2006
48.056
-1.944
-3.89%
jan 1, 2007
48.889
+0.833
1.73%
jan 1, 2008
50.0
+1.111
2.27%
jan 1, 2009
51.111
+1.111
2.22%
jan 1, 2010
53.889
+2.778
5.43%
jan 1, 2011
55.556
+1.667
3.09%
jan 1, 2012
55.0
-0.556
-1.0%
jan 1, 2013
55.833
+0.833
1.52%
jan 1, 2014
55.0
-0.833
-1.49%
jan 1, 2015
55.278
+0.278
0.51%
jan 1, 2016
55.278
0.0
0.0%
jan 1, 2017
57.5
+2.222
4.02%
Ranking of countries by current statistics by years