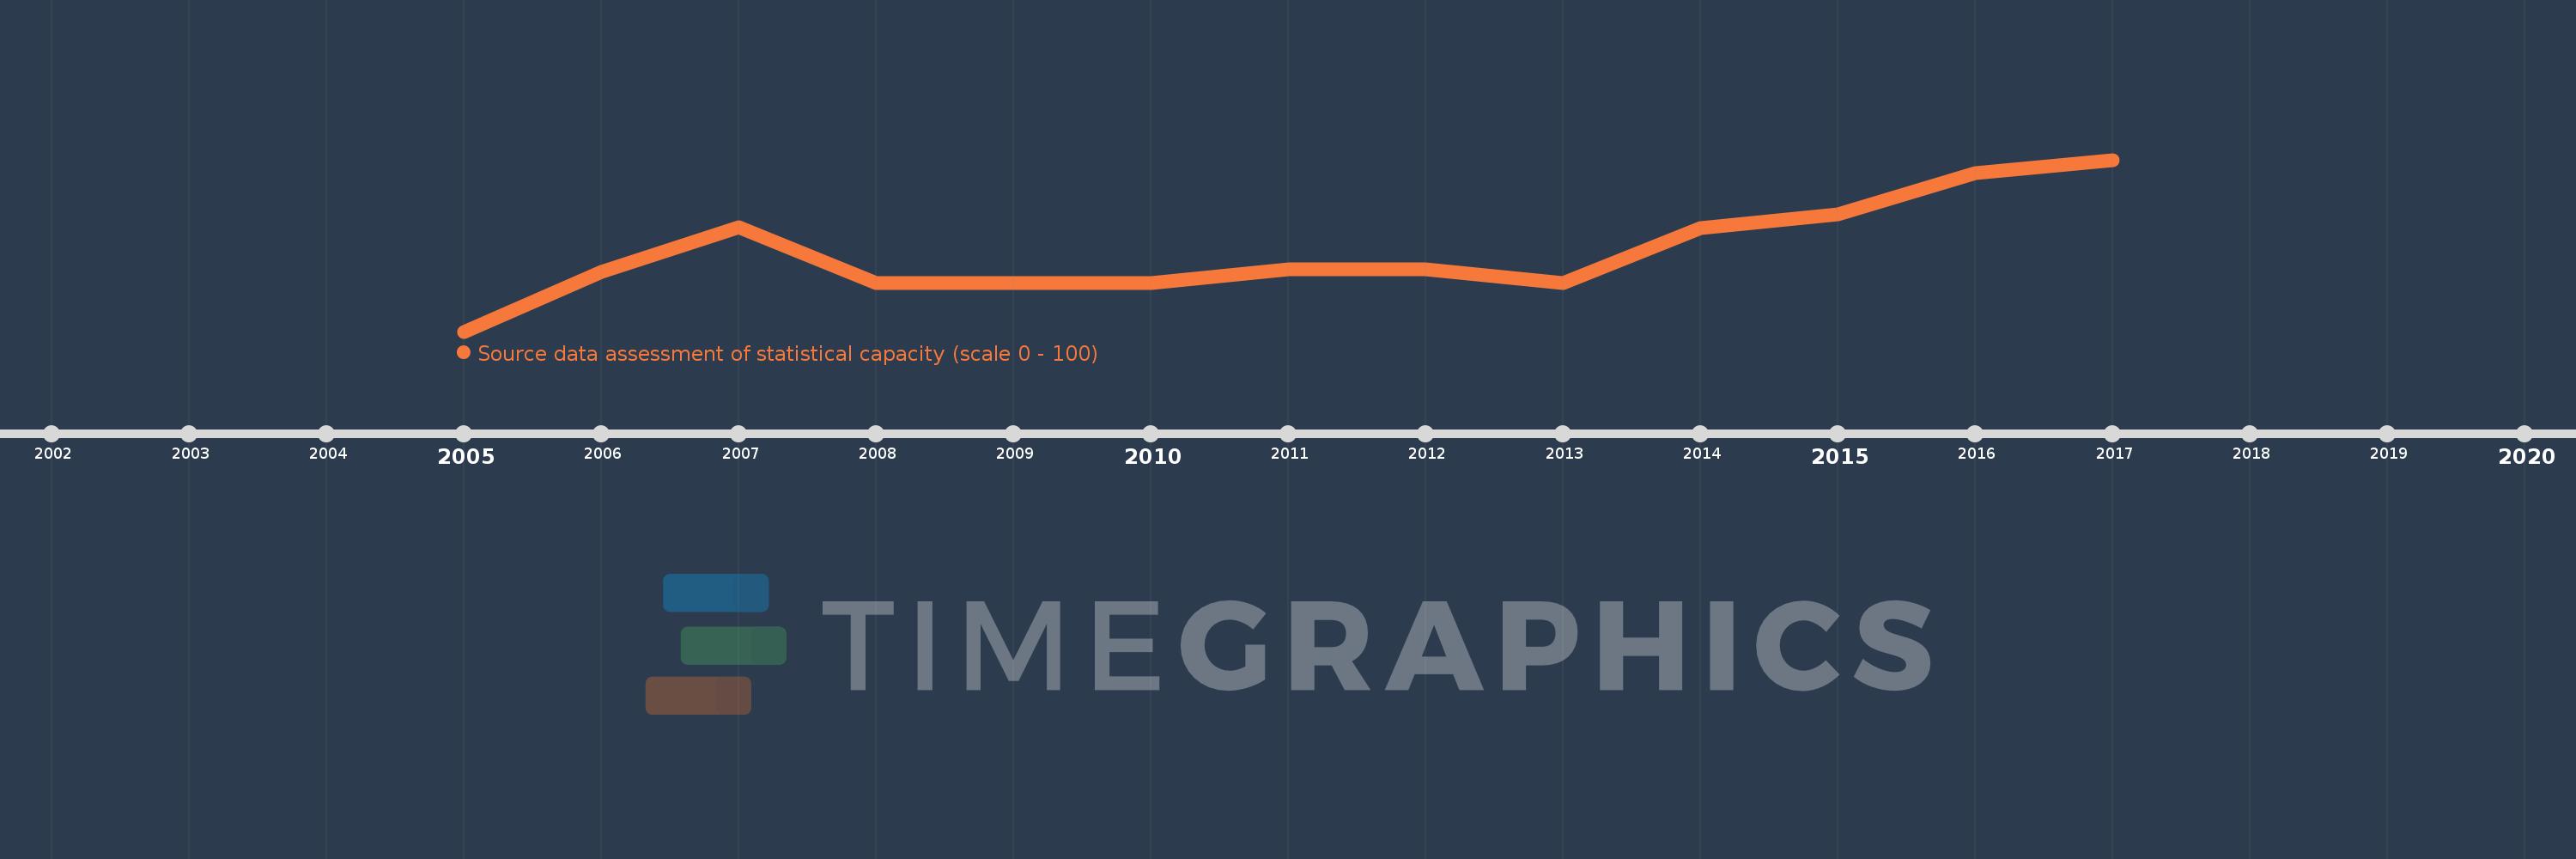
This timeline shows a graph from 2005 to 2017 of East Asia & Pacific (IDA & IBRD countries). No data until 2004. Number of actual observations by date: 13.
Source name:
World Development Indicators
Source organization:
World Bank
Categories, topics:
Public Sector
Last updated:
apr 23, 2017
Indicators value changes by year
Meaning:
69.382
Minimum:
64.545
jan 1, 2005
Maximum:
75.0
jan 1, 2017
At the date of observation
Value
Absolute change
Change from the previous value
jan 1, 2005
64.545
+64.545
0.0%
jan 1, 2006
68.182
+3.636
5.63%
jan 1, 2007
70.909
+2.727
4.0%
jan 1, 2008
67.5
-3.409
-4.81%
jan 1, 2009
67.5
0.0
0.0%
jan 1, 2010
67.5
0.0
0.0%
jan 1, 2011
68.333
+0.833
1.23%
jan 1, 2012
68.333
0.0
0.0%
jan 1, 2013
67.5
-0.833
-1.22%
jan 1, 2014
70.833
+3.333
4.94%
jan 1, 2015
71.667
+0.833
1.18%
jan 1, 2016
74.167
+2.5
3.49%
jan 1, 2017
75.0
+0.833
1.12%
Ranking of countries by current statistics by years