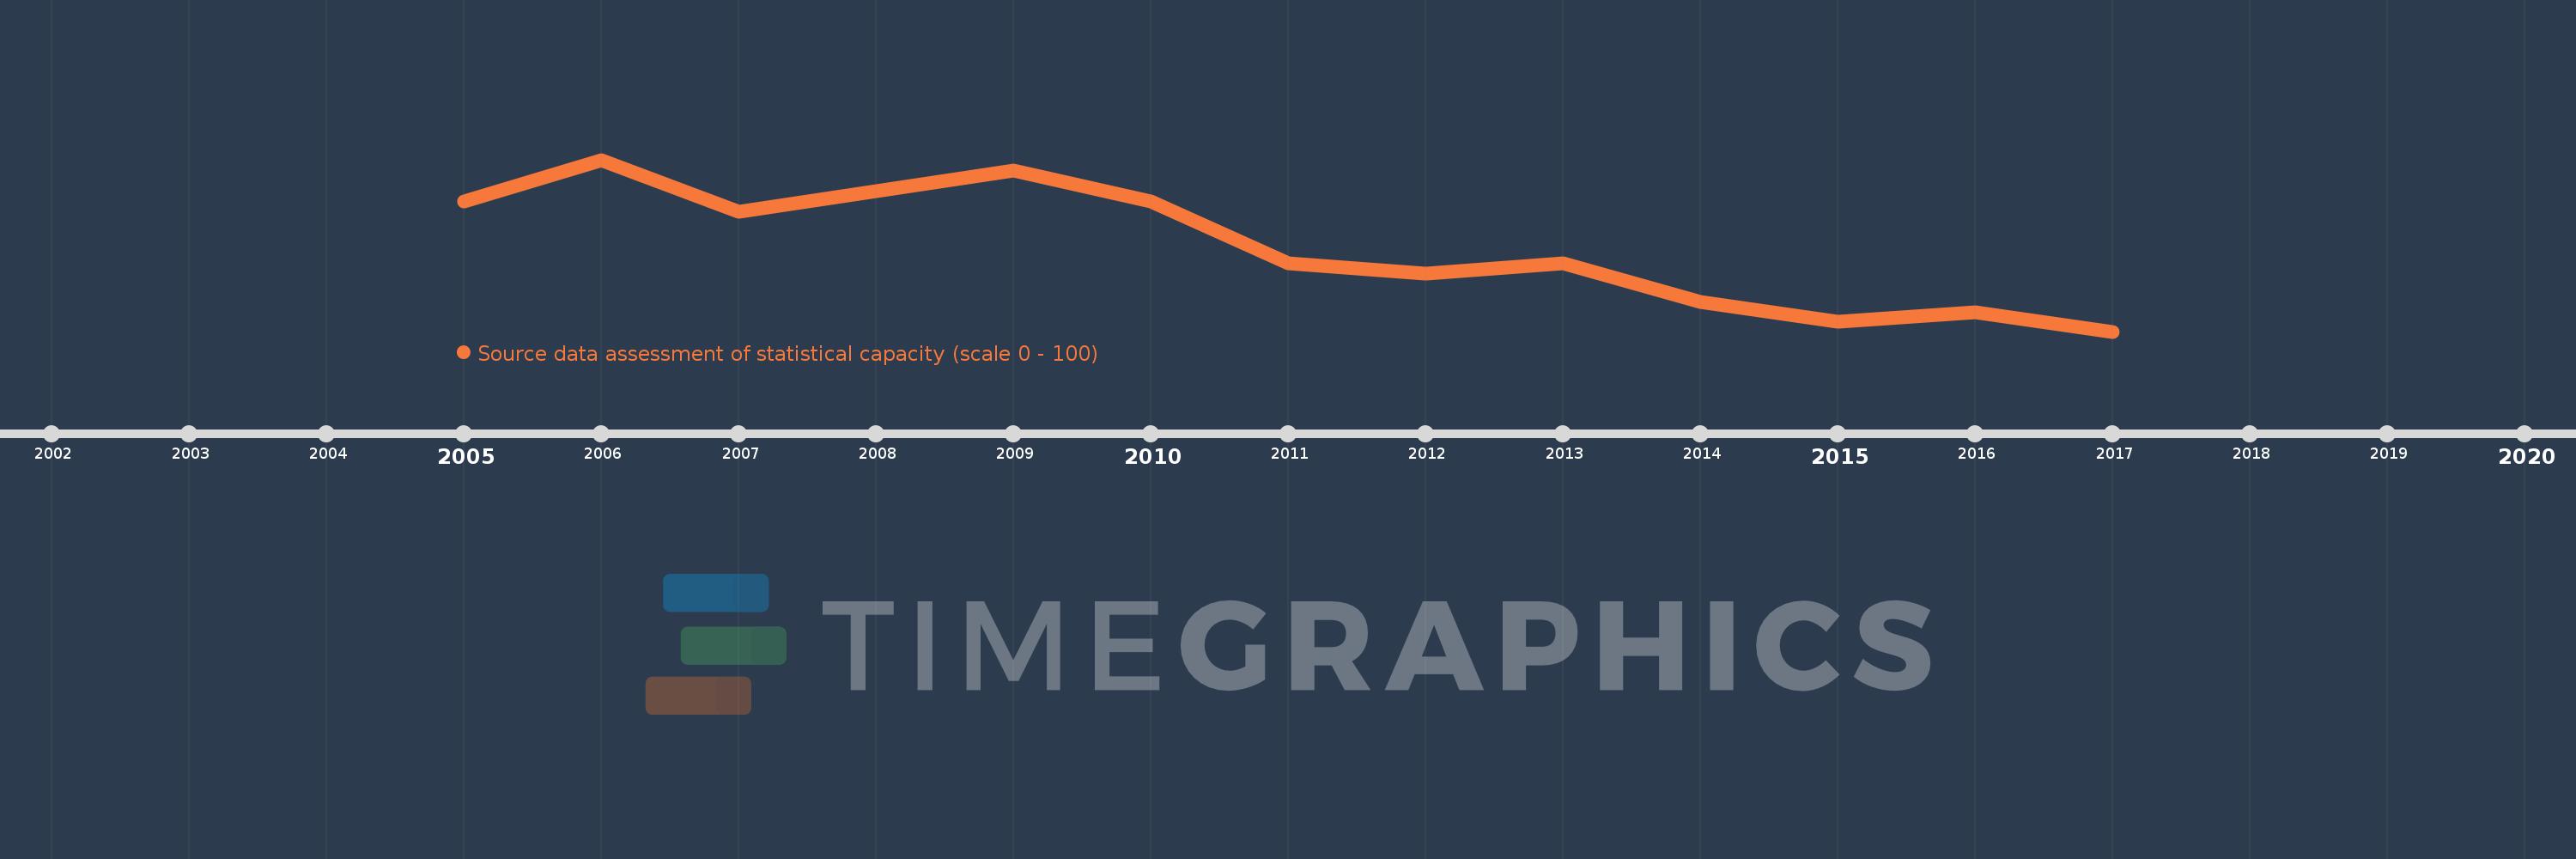
This timeline shows a graph from 2005 to 2017 of Europe & Central Asia (IDA & IBRD countries). No data until 2004. Number of actual observations by date: 13.
Source name:
World Development Indicators
Source organization:
World Bank
Categories, topics:
Public Sector
Last updated:
apr 23, 2017
Indicators value changes by year
Meaning:
80.3
Minimum:
76.364
jan 1, 2017
Maximum:
84.286
jan 1, 2006
At the date of observation
Value
Absolute change
Change from the previous value
jan 1, 2005
82.381
+82.381
0.0%
jan 1, 2006
84.286
+1.905
2.31%
jan 1, 2007
81.905
-2.381
-2.82%
jan 1, 2008
82.857
+0.952
1.16%
jan 1, 2009
83.81
+0.952
1.15%
jan 1, 2010
82.381
-1.429
-1.7%
jan 1, 2011
79.524
-2.857
-3.47%
jan 1, 2012
79.048
-0.476
-0.6%
jan 1, 2013
79.524
+0.476
0.6%
jan 1, 2014
77.727
-1.797
-2.26%
jan 1, 2015
76.818
-0.909
-1.17%
jan 1, 2016
77.273
+0.455
0.59%
jan 1, 2017
76.364
-0.909
-1.18%
Ranking of countries by current statistics by years