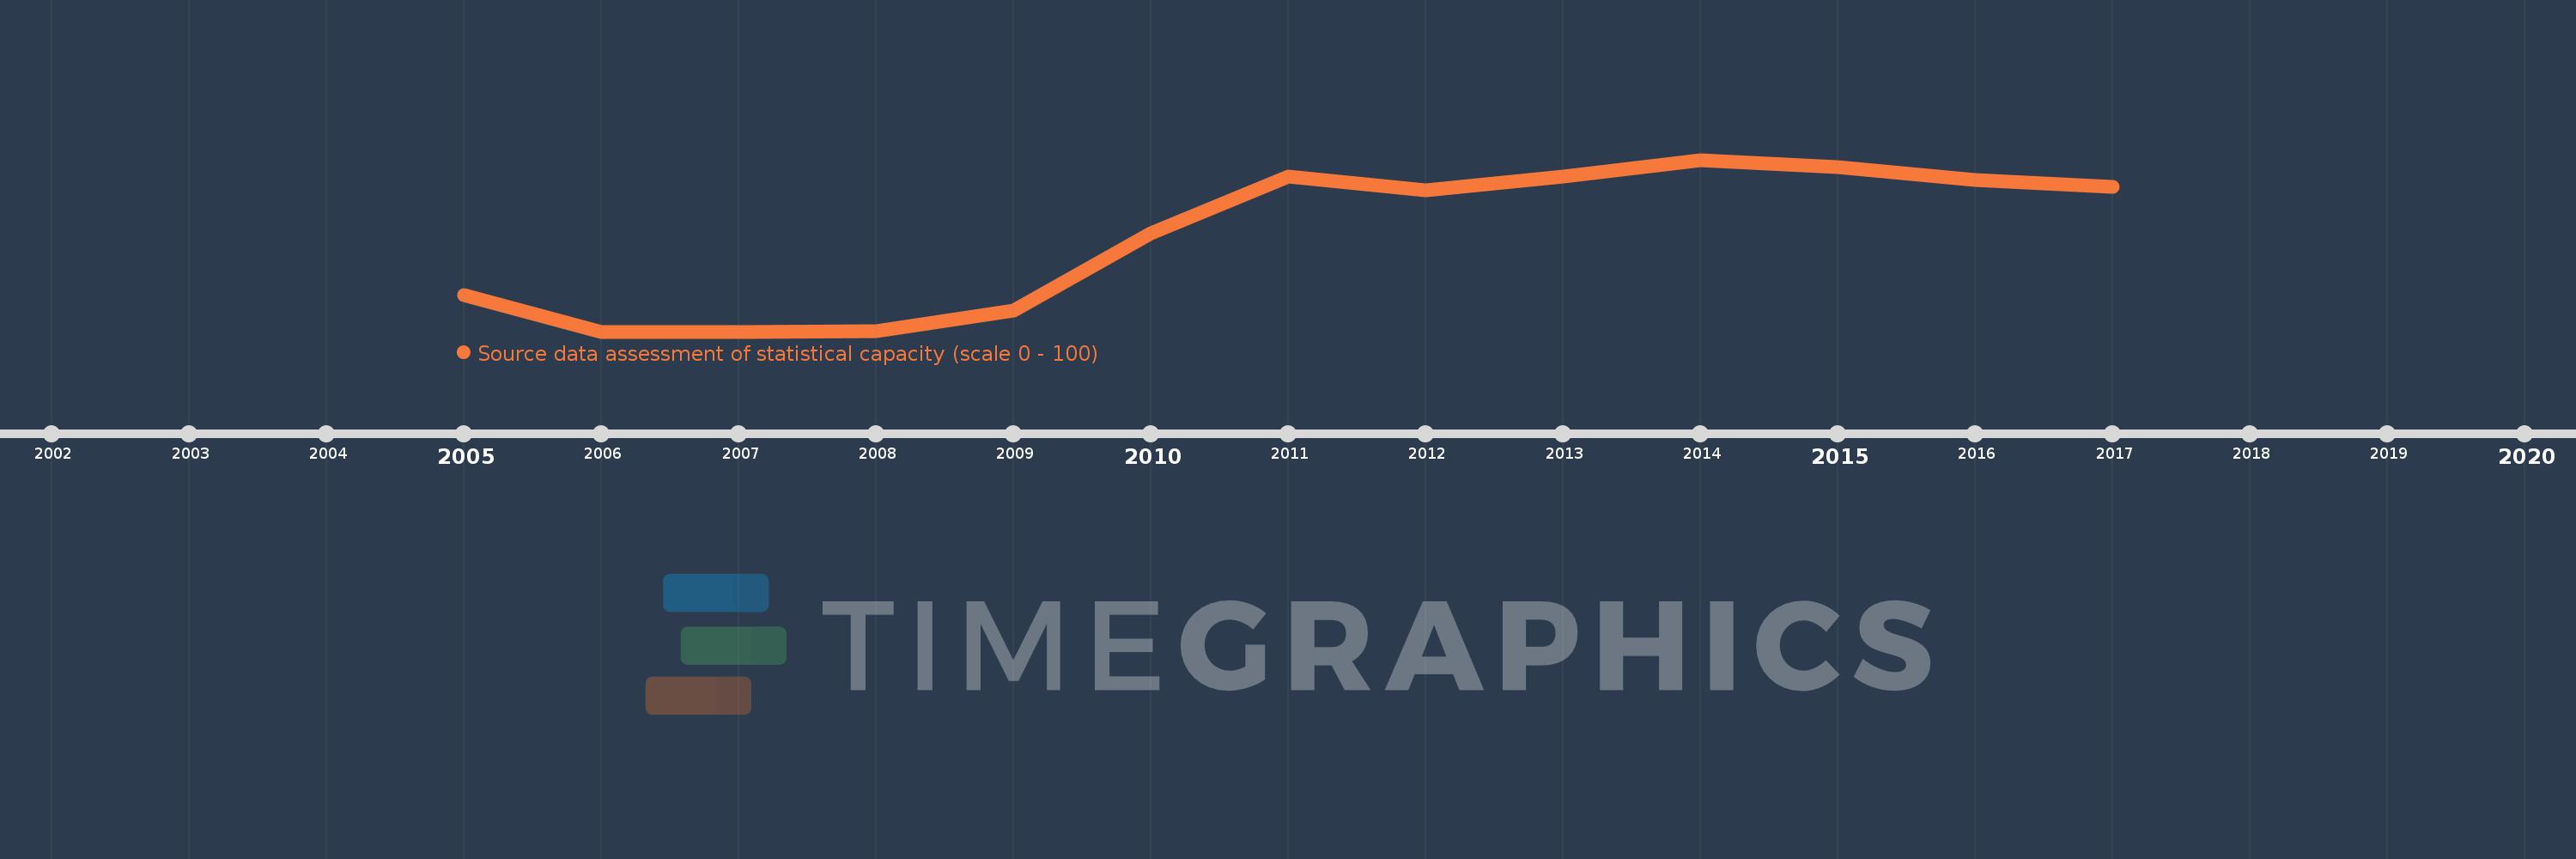
This timeline shows a graph from 2005 to 2017 of Least developed countries: UN classification. No data until 2004. Number of actual observations by date: 13.
Source name:
World Development Indicators
Source organization:
World Bank
Categories, topics:
Public Sector
Last updated:
apr 23, 2017
Indicators value changes by year
Meaning:
53.295
Minimum:
49.73
jan 1, 2006
Maximum:
56.154
jan 1, 2014
At the date of observation
Value
Absolute change
Change from the previous value
jan 1, 2005
51.081
+51.081
0.0%
jan 1, 2006
49.73
-1.351
-2.65%
jan 1, 2007
49.73
0.0
0.0%
jan 1, 2008
49.737
+0.007
0.01%
jan 1, 2009
50.526
+0.789
1.59%
jan 1, 2010
53.421
+2.895
5.73%
jan 1, 2011
55.526
+2.105
3.94%
jan 1, 2012
55.0
-0.526
-0.95%
jan 1, 2013
55.526
+0.526
0.96%
jan 1, 2014
56.154
+0.628
1.13%
jan 1, 2015
55.897
-0.256
-0.46%
jan 1, 2016
55.385
-0.513
-0.92%
jan 1, 2017
55.128
-0.256
-0.46%
Ranking of countries by current statistics by years