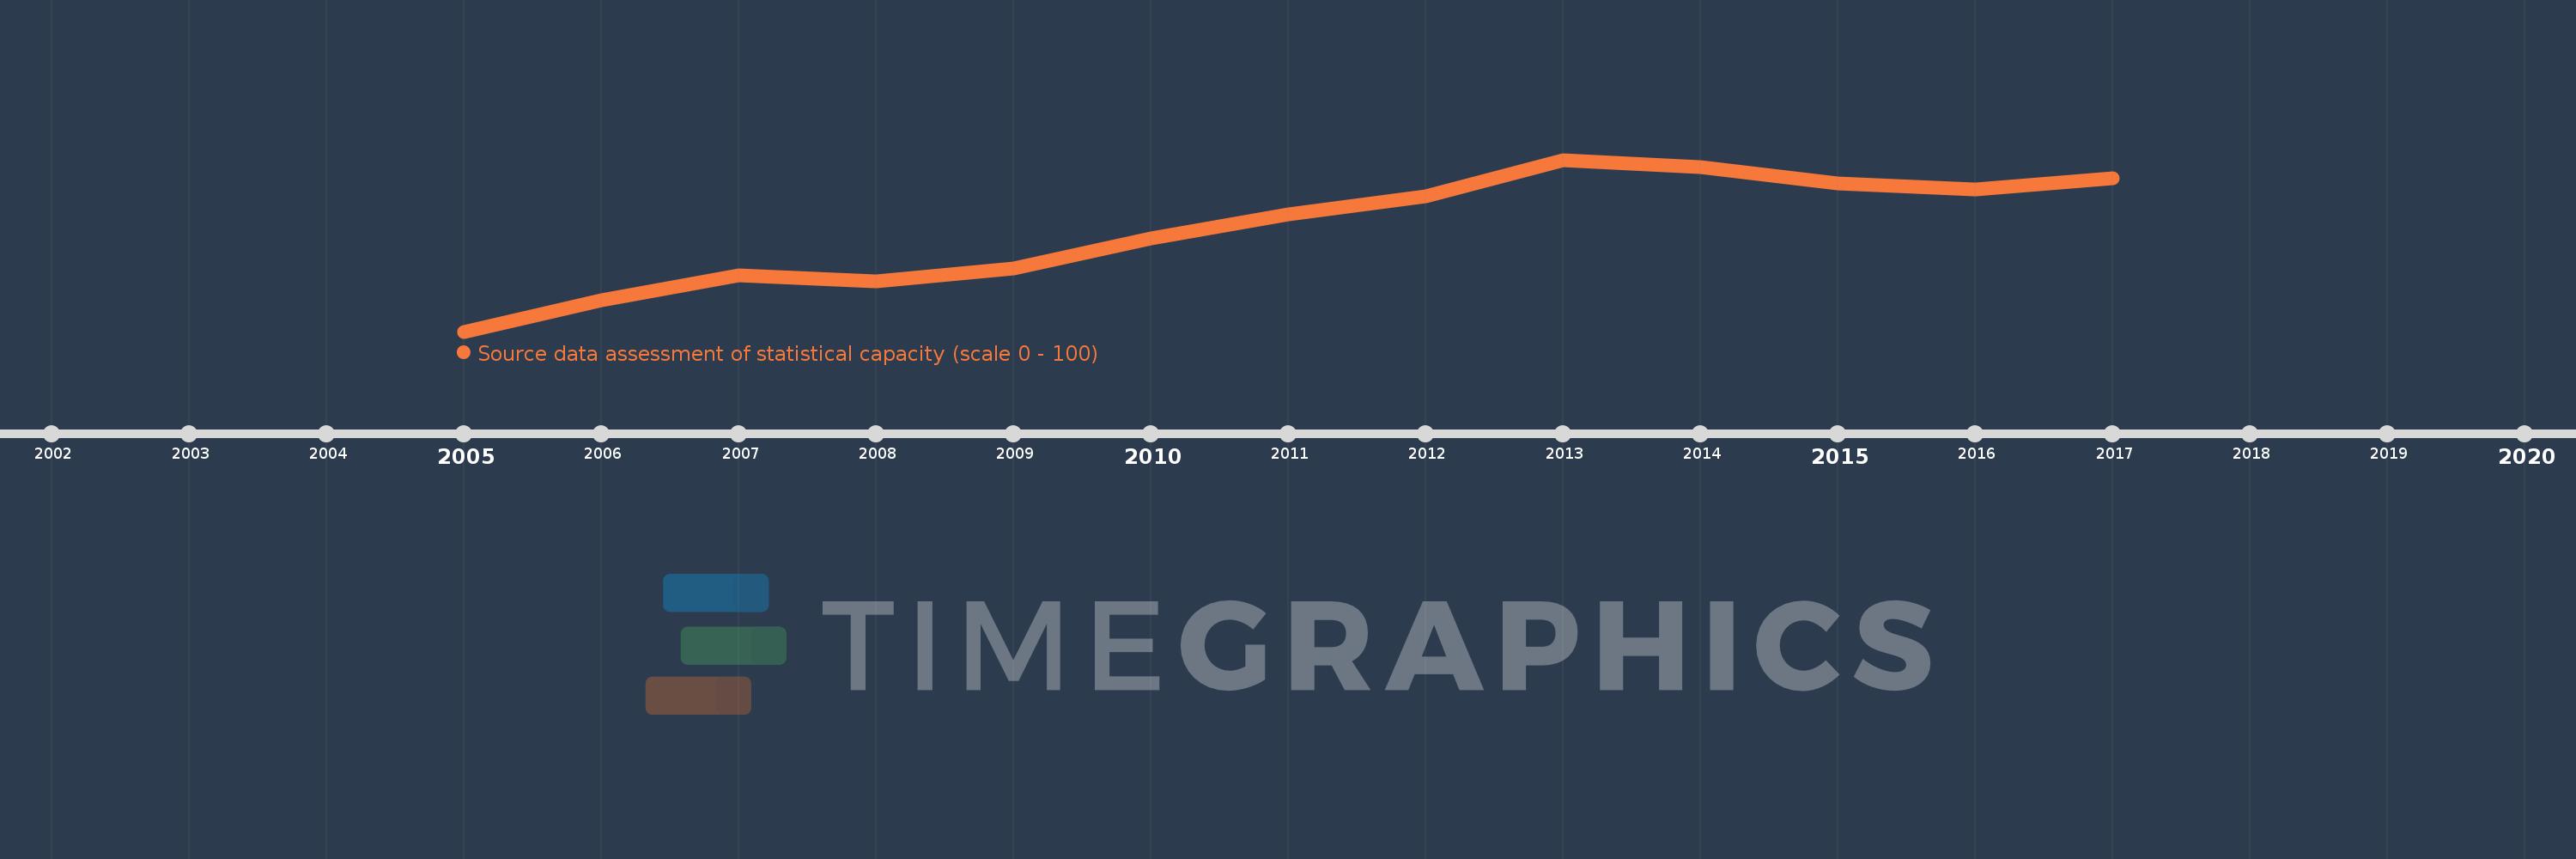
This timeline shows a graph from 2005 to 2017 of Fragile and conflict affected situations. No data until 2004. Number of actual observations by date: 13.
Source name:
World Development Indicators
Source organization:
World Bank
Categories, topics:
Public Sector
Last updated:
apr 23, 2017
Indicators value changes by year
Meaning:
41.715
Minimum:
35.2
jan 1, 2005
Maximum:
46.154
jan 1, 2013
At the date of observation
Value
Absolute change
Change from the previous value
jan 1, 2005
35.2
+35.2
0.0%
jan 1, 2006
37.2
+2.0
5.68%
jan 1, 2007
38.8
+1.6
4.3%
jan 1, 2008
38.4
-0.4
-1.03%
jan 1, 2009
39.2
+0.8
2.08%
jan 1, 2010
41.154
+1.954
4.98%
jan 1, 2011
42.692
+1.538
3.74%
jan 1, 2012
43.846
+1.154
2.7%
jan 1, 2013
46.154
+2.308
5.26%
jan 1, 2014
45.714
-0.44
-0.95%
jan 1, 2015
44.643
-1.071
-2.34%
jan 1, 2016
44.286
-0.357
-0.8%
jan 1, 2017
45.0
+0.714
1.61%
Ranking of countries by current statistics by years