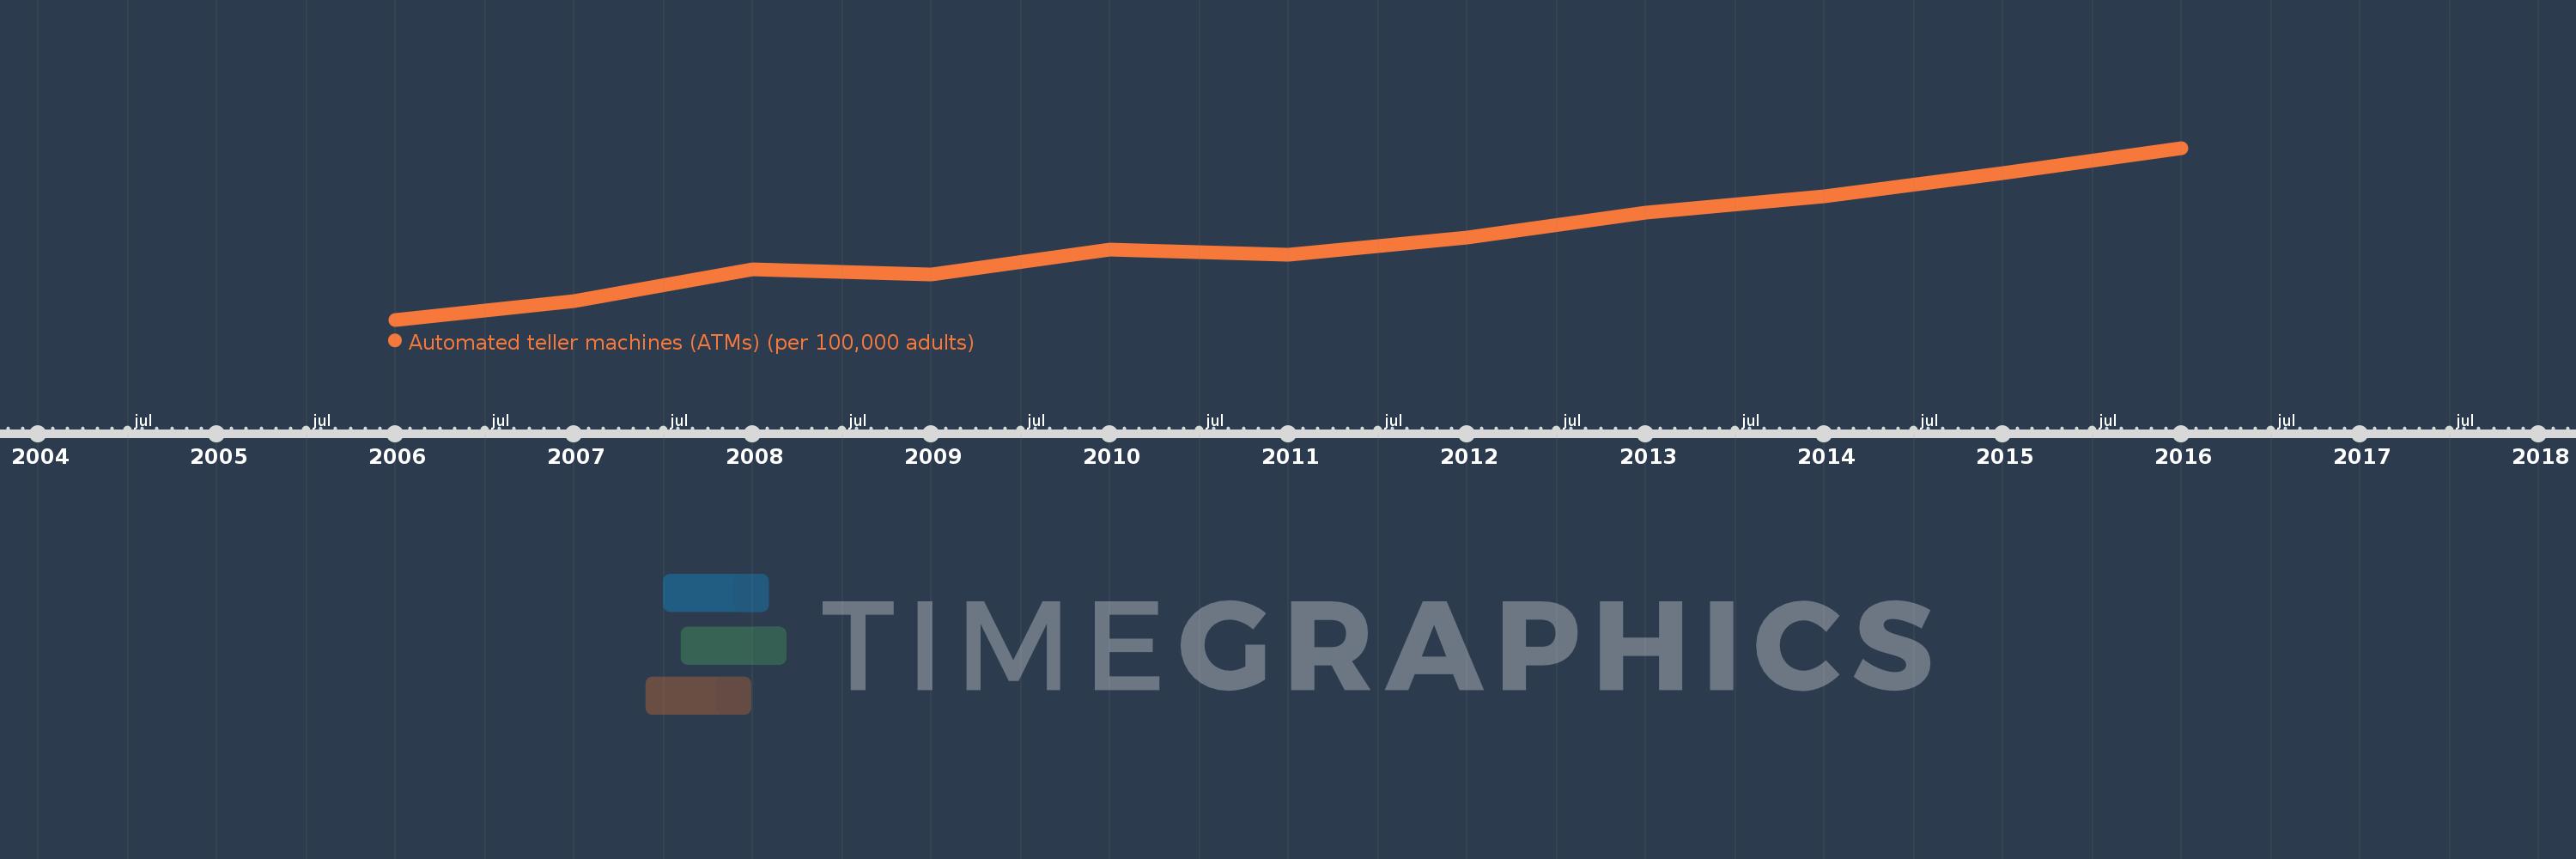
This timeline shows a graph from 2006 to 2016 of Sub-Saharan Africa (excluding high income). No data until 2005. Number of actual observations by date: 11.
Source name:
World Development Indicators
Source organization:
International Monetary Fund, Financial Access Survey.
Categories, topics:
Financial Sector
Last updated:
apr 23, 2017
Indicators value changes by year
Meaning:
3.557
Minimum:
1.307
jan 1, 2006
Maximum:
6.139
jan 1, 2016
At the date of observation
Value
Absolute change
Change from the previous value
jan 1, 2006
1.307
+1.307
0.0%
jan 1, 2007
1.82
+0.513
39.27%
jan 1, 2008
2.737
+0.918
50.42%
jan 1, 2009
2.572
-0.165
-6.03%
jan 1, 2010
3.279
+0.706
27.46%
jan 1, 2011
3.124
-0.155
-4.71%
jan 1, 2012
3.625
+0.5
16.01%
jan 1, 2013
4.33
+0.705
19.45%
jan 1, 2014
4.772
+0.443
10.23%
jan 1, 2015
5.427
+0.654
13.71%
jan 1, 2016
6.139
+0.712
13.12%
Ranking of countries by current statistics by years