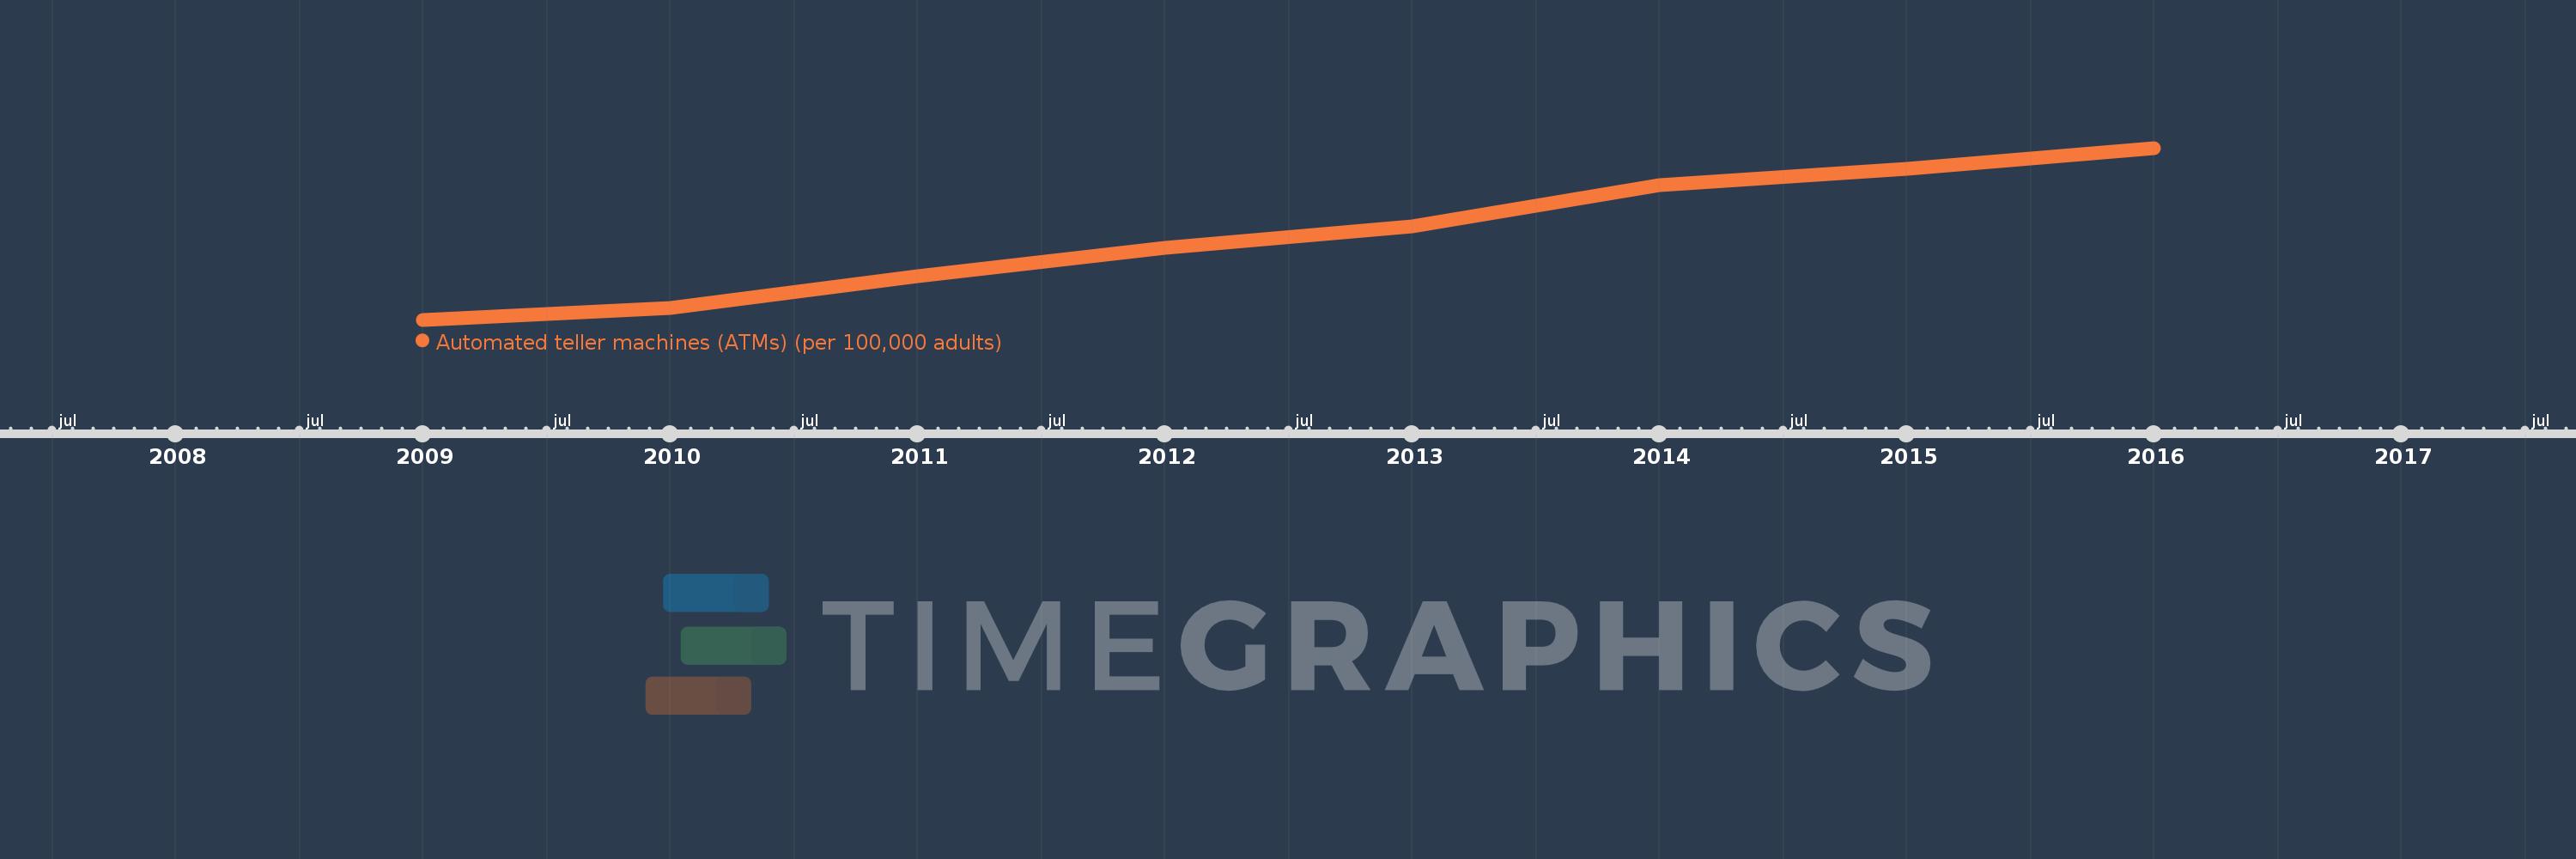
This timeline shows a graph from 2009 to 2016 of Least developed countries: UN classification. No data until 2008. Number of actual observations by date: 8.
Source name:
World Development Indicators
Source organization:
International Monetary Fund, Financial Access Survey.
Categories, topics:
Financial Sector
Last updated:
apr 23, 2017
Indicators value changes by year
Meaning:
3.252
Minimum:
1.477
jan 1, 2009
Maximum:
5.073
jan 1, 2016
At the date of observation
Value
Absolute change
Change from the previous value
jan 1, 2009
1.477
+1.477
0.0%
jan 1, 2010
1.722
+0.245
16.61%
jan 1, 2011
2.395
+0.673
39.07%
jan 1, 2012
2.974
+0.579
24.18%
jan 1, 2013
3.44
+0.466
15.67%
jan 1, 2014
4.299
+0.859
24.97%
jan 1, 2015
4.64
+0.342
7.95%
jan 1, 2016
5.073
+0.433
9.33%
Ranking of countries by current statistics by years