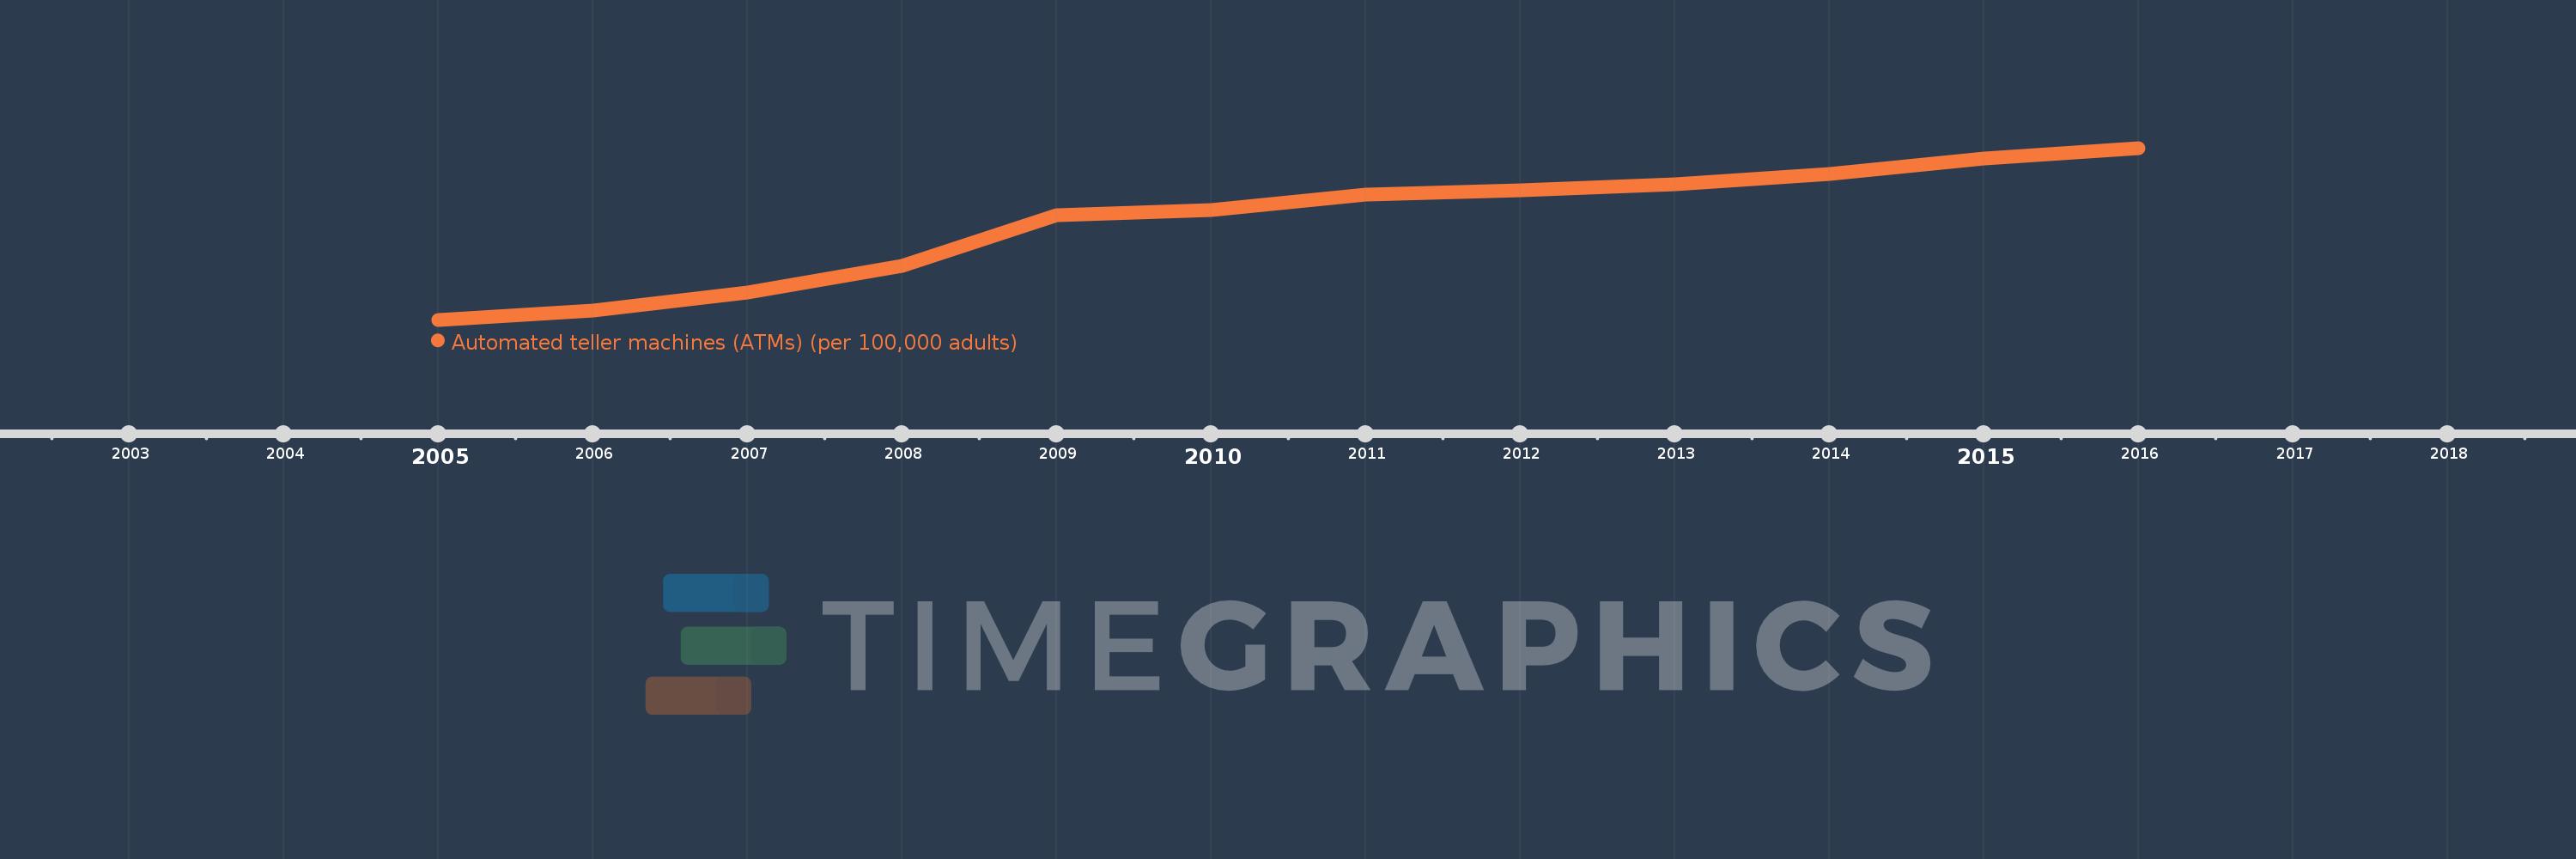
This timeline shows a graph from 2005 to 2016 of Europe & Central Asia (IDA & IBRD countries). No data until 2004. Number of actual observations by date: 12.
Source name:
World Development Indicators
Source organization:
International Monetary Fund, Financial Access Survey.
Categories, topics:
Financial Sector
Last updated:
apr 23, 2017
Indicators value changes by year
Meaning:
38.155
Minimum:
10.424
jan 1, 2005
Maximum:
59.133
jan 1, 2016
At the date of observation
Value
Absolute change
Change from the previous value
jan 1, 2005
10.424
+10.424
0.0%
jan 1, 2006
13.098
+2.674
25.65%
jan 1, 2007
18.111
+5.013
38.27%
jan 1, 2008
25.678
+7.567
41.78%
jan 1, 2009
39.971
+14.293
55.66%
jan 1, 2010
41.508
+1.537
3.85%
jan 1, 2011
45.99
+4.482
10.8%
jan 1, 2012
47.153
+1.163
2.53%
jan 1, 2013
48.762
+1.609
3.41%
jan 1, 2014
51.789
+3.027
6.21%
jan 1, 2015
56.245
+4.456
8.6%
jan 1, 2016
59.133
+2.887
5.13%
Ranking of countries by current statistics by years