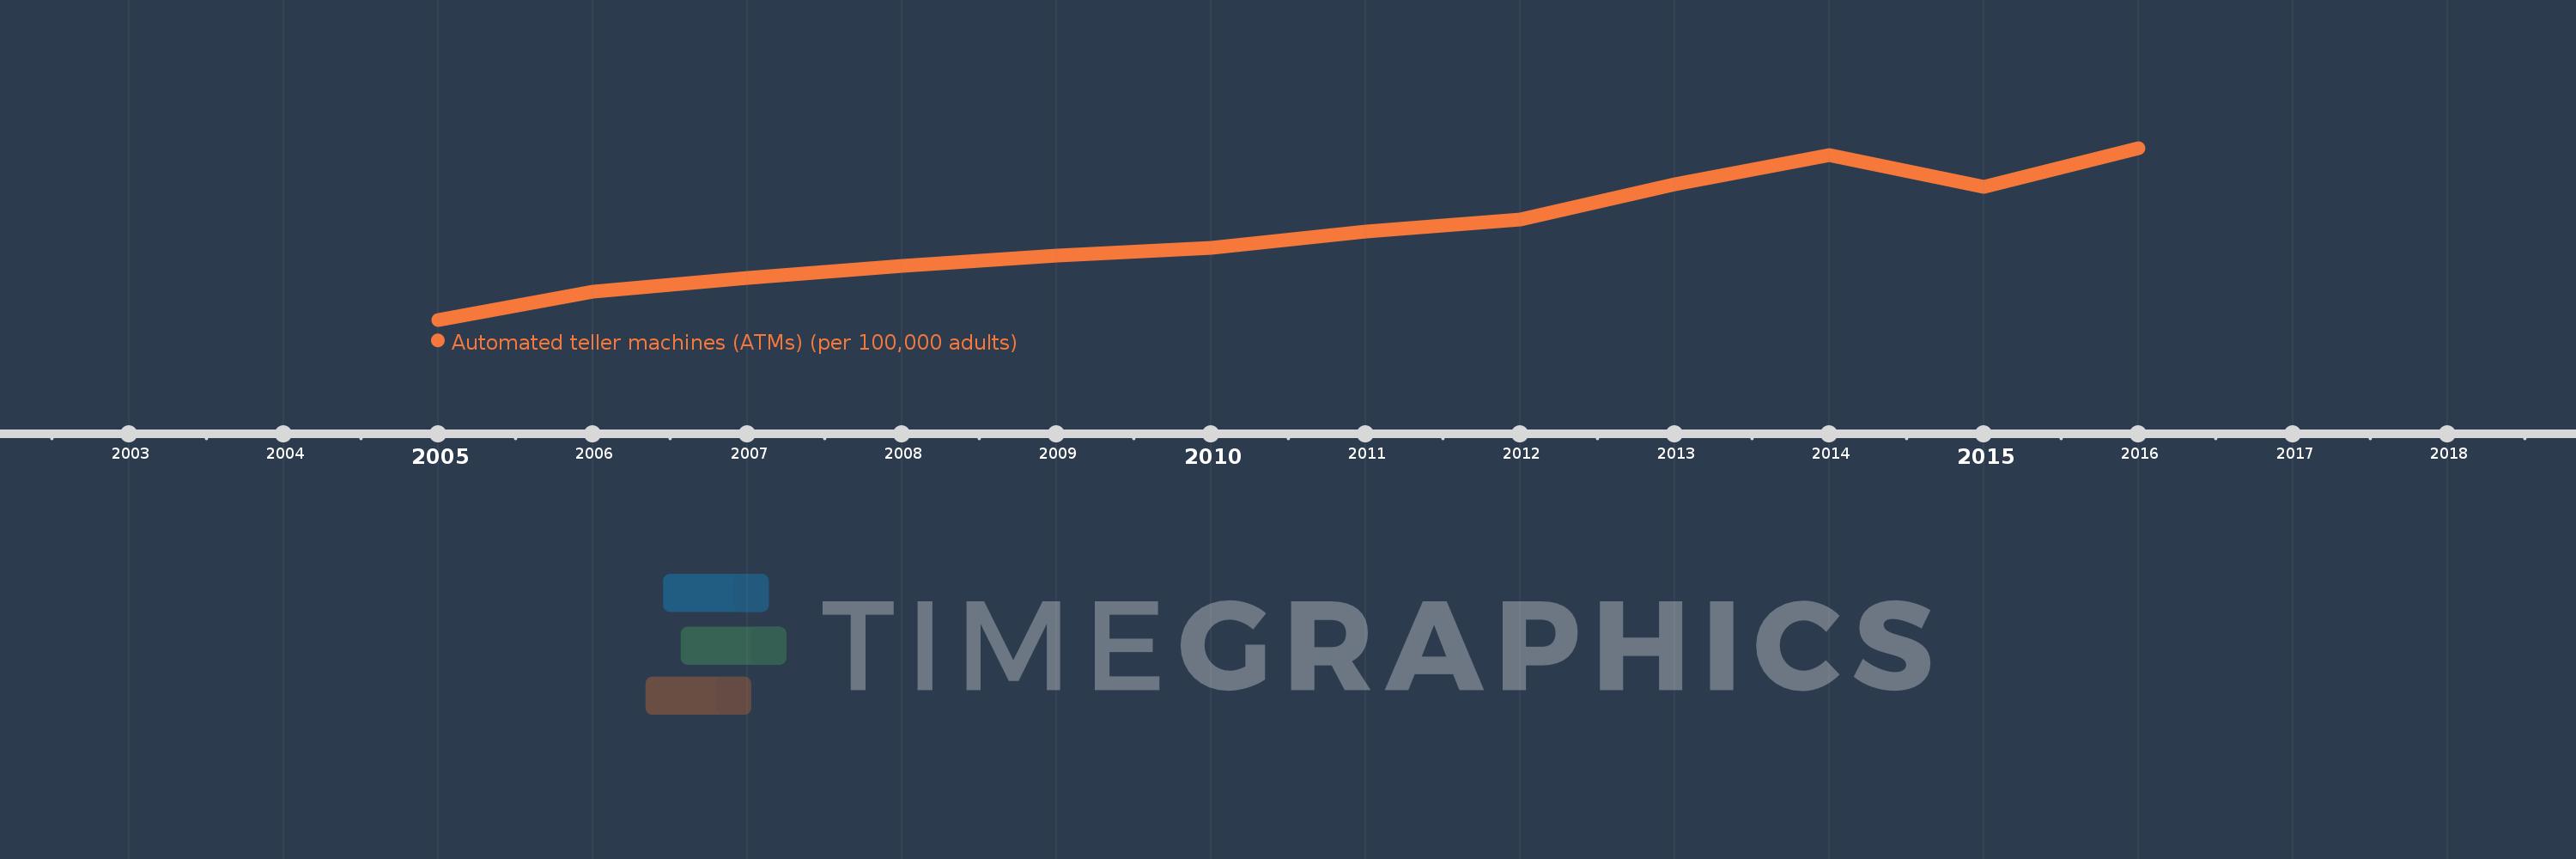
This timeline shows a graph from 2005 to 2016 of Latin America & Caribbean (excluding high income). No data until 2004. Number of actual observations by date: 12.
Source name:
World Development Indicators
Source organization:
International Monetary Fund, Financial Access Survey.
Categories, topics:
Financial Sector
Last updated:
apr 23, 2017
Indicators value changes by year
Meaning:
29.46
Minimum:
19.058
jan 1, 2005
Maximum:
39.44
jan 1, 2016
At the date of observation
Value
Absolute change
Change from the previous value
jan 1, 2005
19.058
+19.058
0.0%
jan 1, 2006
22.379
+3.321
17.42%
jan 1, 2007
24.012
+1.633
7.3%
jan 1, 2008
25.49
+1.478
6.16%
jan 1, 2009
26.634
+1.144
4.49%
jan 1, 2010
27.573
+0.939
3.53%
jan 1, 2011
29.491
+1.917
6.95%
jan 1, 2012
30.911
+1.42
4.81%
jan 1, 2013
35.159
+4.248
13.74%
jan 1, 2014
38.576
+3.417
9.72%
jan 1, 2015
34.791
-3.784
-9.81%
jan 1, 2016
39.44
+4.648
13.36%
Ranking of countries by current statistics by years