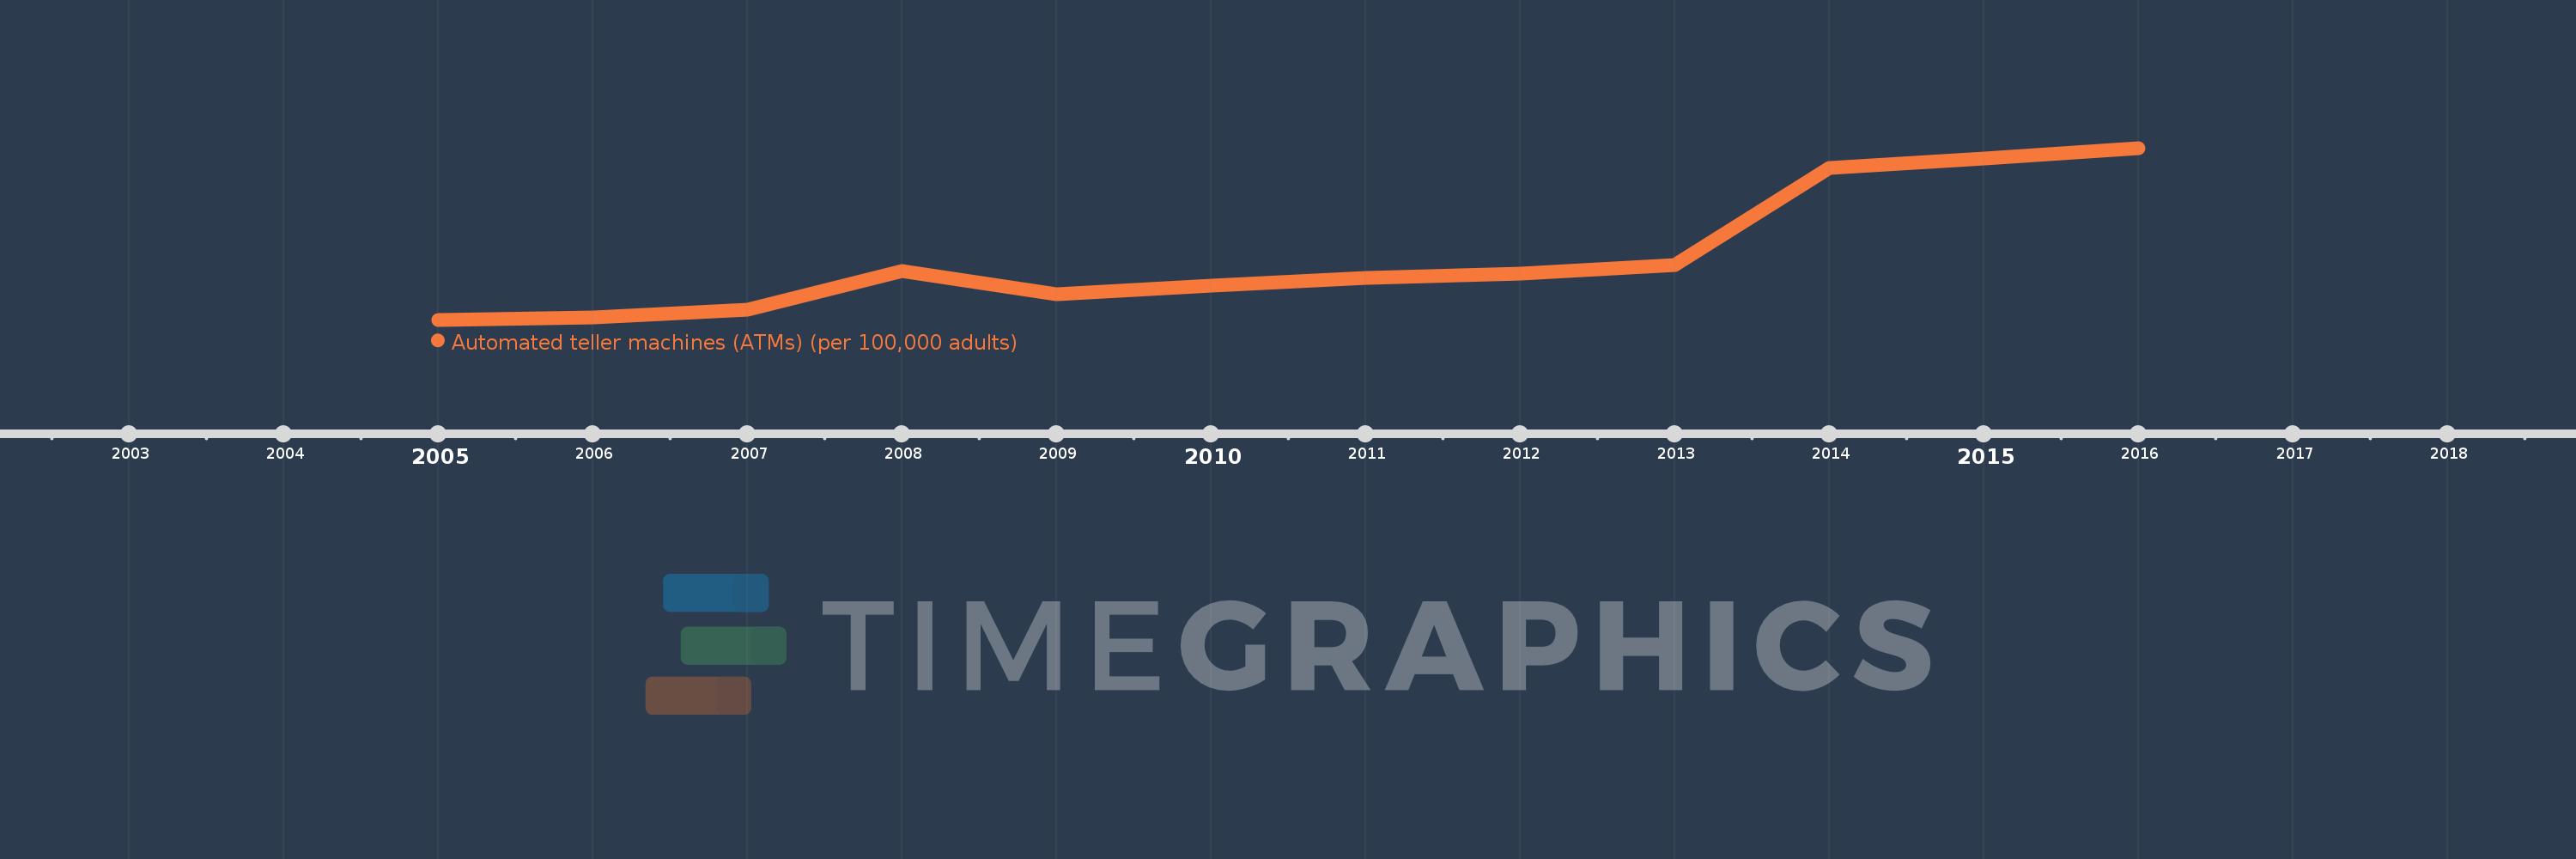
This timeline shows a graph from 2005 to 2016 of Middle East & North Africa (IDA & IBRD countries). No data until 2004. Number of actual observations by date: 12.
Source name:
World Development Indicators
Source organization:
International Monetary Fund, Financial Access Survey.
Categories, topics:
Financial Sector
Last updated:
apr 23, 2017
Indicators value changes by year
Meaning:
11.411
Minimum:
3.046
jan 1, 2005
Maximum:
26.096
jan 1, 2016
At the date of observation
Value
Absolute change
Change from the previous value
jan 1, 2005
3.046
+3.046
0.0%
jan 1, 2006
3.371
+0.325
10.69%
jan 1, 2007
4.426
+1.055
31.3%
jan 1, 2008
9.6
+5.174
116.89%
jan 1, 2009
6.46
-3.139
-32.7%
jan 1, 2010
7.675
+1.215
18.81%
jan 1, 2011
8.634
+0.958
12.49%
jan 1, 2012
9.225
+0.591
6.84%
jan 1, 2013
10.337
+1.112
12.06%
jan 1, 2014
23.357
+13.02
125.96%
jan 1, 2015
24.708
+1.351
5.78%
jan 1, 2016
26.096
+1.388
5.62%
Ranking of countries by current statistics by years