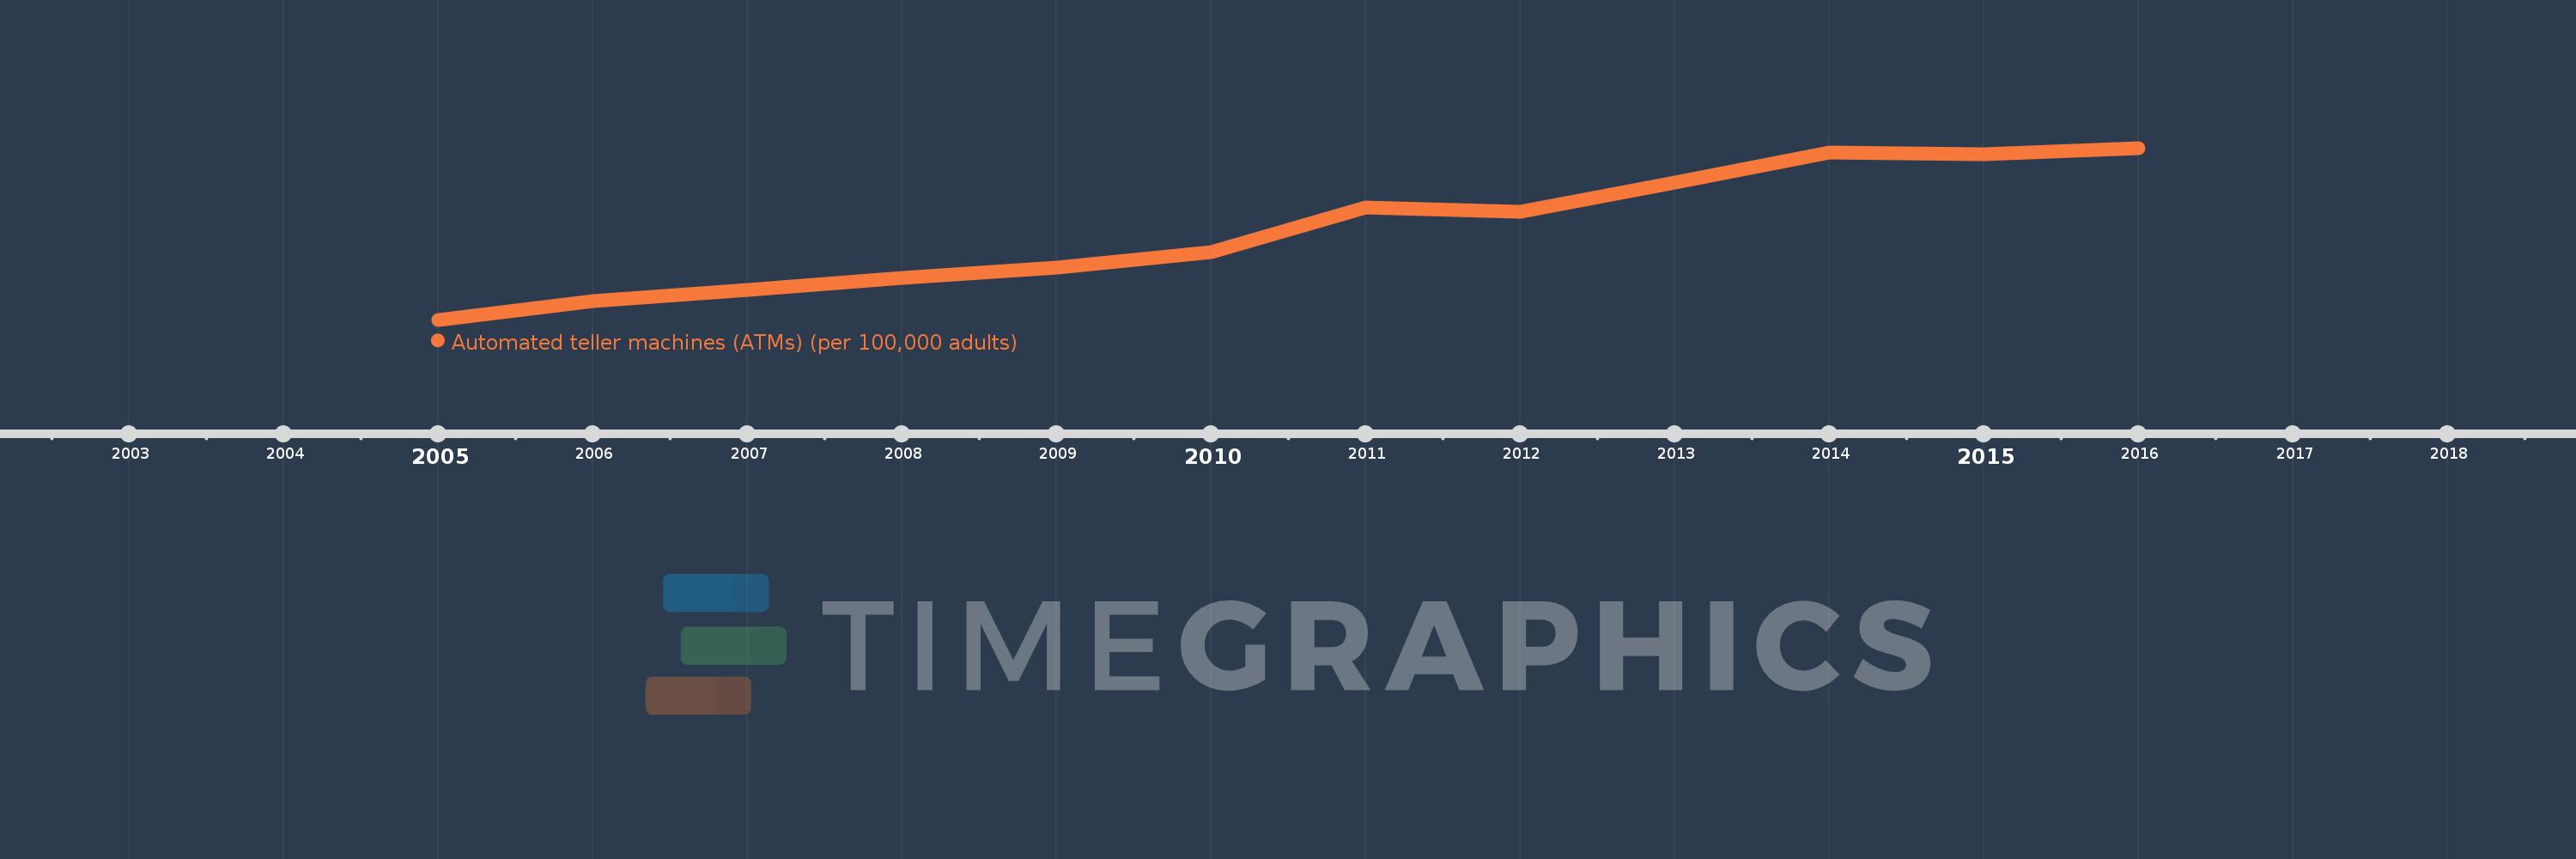
This timeline shows a graph from 2005 to 2016 of Latin America & the Caribbean (IDA & IBRD countries). No data until 2004. Number of actual observations by date: 12.
Source name:
World Development Indicators
Source organization:
International Monetary Fund, Financial Access Survey.
Categories, topics:
Financial Sector
Last updated:
apr 23, 2017
Indicators value changes by year
Meaning:
31.182
Minimum:
20.533
jan 1, 2005
Maximum:
41.022
jan 1, 2016
At the date of observation
Value
Absolute change
Change from the previous value
jan 1, 2005
20.533
+20.533
0.0%
jan 1, 2006
22.794
+2.261
11.01%
jan 1, 2007
24.043
+1.249
5.48%
jan 1, 2008
25.52
+1.477
6.14%
jan 1, 2009
26.711
+1.191
4.67%
jan 1, 2010
28.611
+1.9
7.11%
jan 1, 2011
33.947
+5.336
18.65%
jan 1, 2012
33.409
-0.537
-1.58%
jan 1, 2013
36.893
+3.483
10.43%
jan 1, 2014
40.433
+3.54
9.59%
jan 1, 2015
40.265
-0.168
-0.41%
jan 1, 2016
41.022
+0.757
1.88%
Ranking of countries by current statistics by years