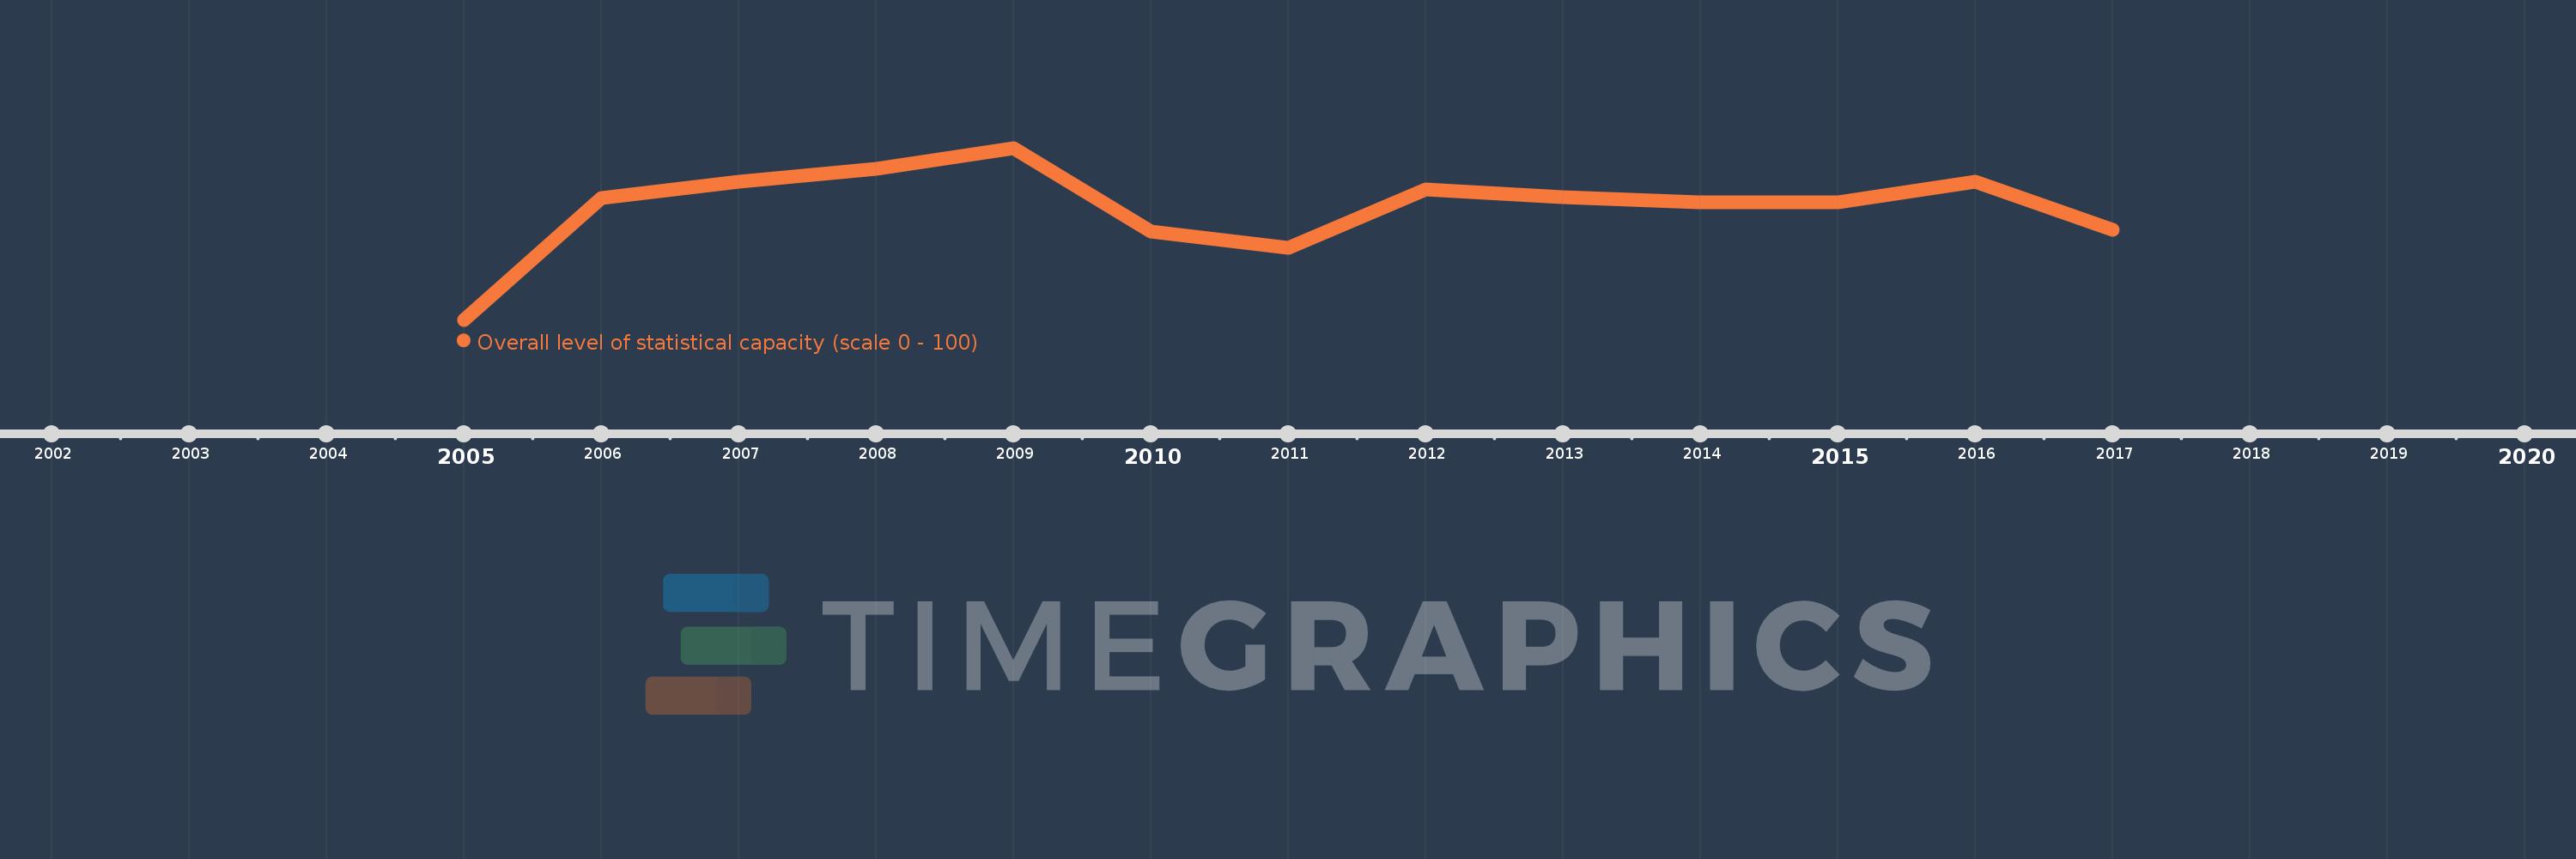
This timeline shows a graph from 2005 to 2017 of Middle East & North Africa (excluding high income). No data until 2004. Number of actual observations by date: 13.
Source name:
World Development Indicators
Source organization:
World Bank
Categories, topics:
Public Sector
Last updated:
apr 23, 2017
Indicators value changes by year
Meaning:
63.189
Minimum:
57.778
jan 1, 2005
Maximum:
66.061
jan 1, 2009
At the date of observation
Value
Absolute change
Change from the previous value
jan 1, 2005
57.778
+57.778
0.0%
jan 1, 2006
63.636
+5.859
10.14%
jan 1, 2007
64.444
+0.808
1.27%
jan 1, 2008
65.051
+0.606
0.94%
jan 1, 2009
66.061
+1.01
1.55%
jan 1, 2010
62.037
-4.024
-6.09%
jan 1, 2011
61.25
-0.787
-1.27%
jan 1, 2012
64.074
+2.824
4.61%
jan 1, 2013
63.704
-0.37
-0.58%
jan 1, 2014
63.426
-0.278
-0.44%
jan 1, 2015
63.426
0.0
0.0%
jan 1, 2016
64.444
+1.019
1.61%
jan 1, 2017
62.13
-2.315
-3.59%
Ranking of countries by current statistics by years