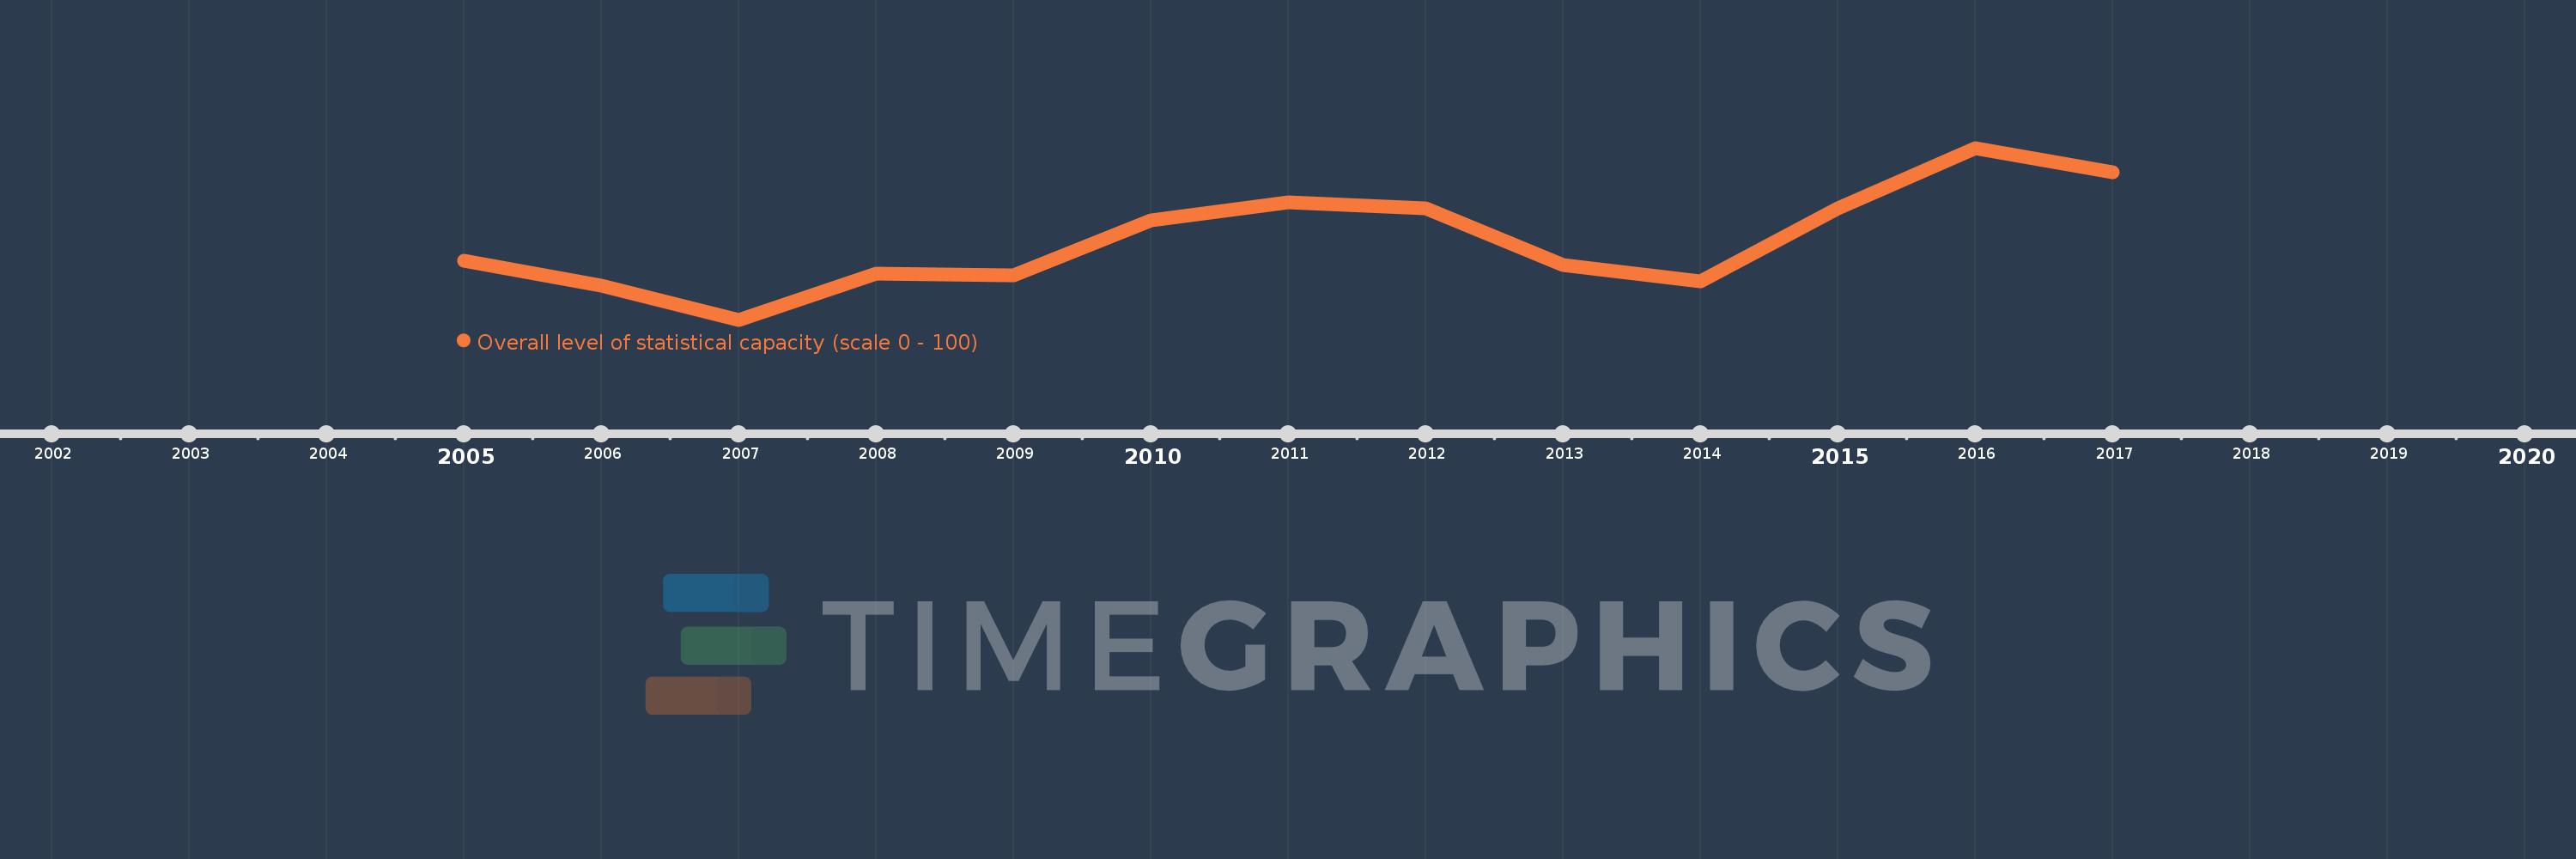
This timeline shows a graph from 2005 to 2017 of Latin America & Caribbean (excluding high income). No data until 2004. Number of actual observations by date: 13.
Source name:
World Development Indicators
Source organization:
World Bank
Categories, topics:
Public Sector
Last updated:
apr 23, 2017
Indicators value changes by year
Meaning:
76.135
Minimum:
73.704
jan 1, 2007
Maximum:
78.951
jan 1, 2016
At the date of observation
Value
Absolute change
Change from the previous value
jan 1, 2005
75.494
+75.494
0.0%
jan 1, 2006
74.753
-0.741
-0.98%
jan 1, 2007
73.704
-1.049
-1.4%
jan 1, 2008
75.123
+1.42
1.93%
jan 1, 2009
75.062
-0.062
-0.08%
jan 1, 2010
76.728
+1.667
2.22%
jan 1, 2011
77.284
+0.556
0.72%
jan 1, 2012
77.099
-0.185
-0.24%
jan 1, 2013
75.37
-1.728
-2.24%
jan 1, 2014
74.877
-0.494
-0.66%
jan 1, 2015
77.099
+2.222
2.97%
jan 1, 2016
78.951
+1.852
2.4%
jan 1, 2017
78.21
-0.741
-0.94%
Ranking of countries by current statistics by years