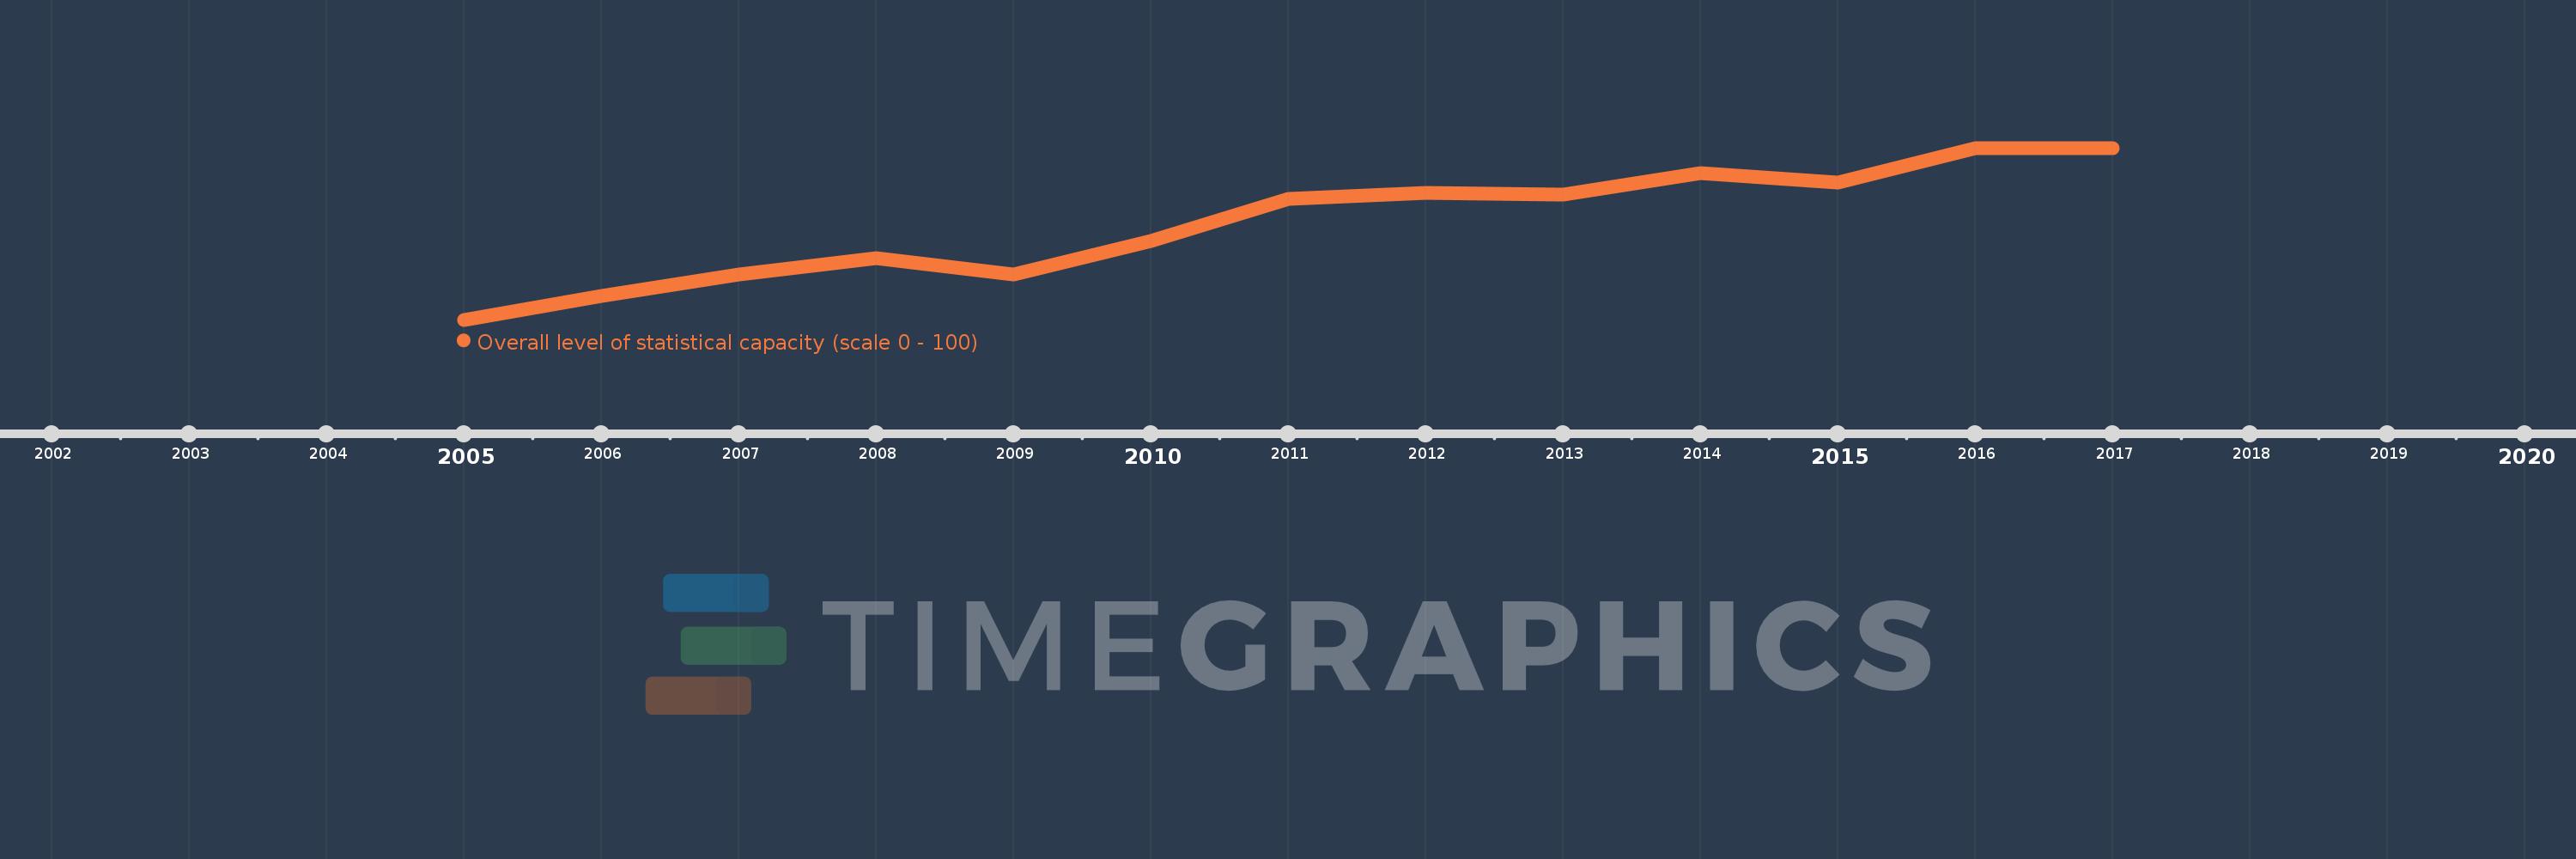
This timeline shows a graph from 2005 to 2017 of Heavily indebted poor countries (HIPC). No data until 2004. Number of actual observations by date: 13.
Source name:
World Development Indicators
Source organization:
World Bank
Categories, topics:
Public Sector
Last updated:
apr 23, 2017
Indicators value changes by year
Meaning:
57.787
Minimum:
53.611
jan 1, 2005
Maximum:
61.049
jan 1, 2017
At the date of observation
Value
Absolute change
Change from the previous value
jan 1, 2005
53.611
+53.611
0.0%
jan 1, 2006
54.63
+1.019
1.9%
jan 1, 2007
55.586
+0.957
1.75%
jan 1, 2008
56.296
+0.71
1.28%
jan 1, 2009
55.556
-0.741
-1.32%
jan 1, 2010
57.006
+1.451
2.61%
jan 1, 2011
58.827
+1.821
3.19%
jan 1, 2012
59.105
+0.278
0.47%
jan 1, 2013
59.012
-0.093
-0.16%
jan 1, 2014
59.969
+0.957
1.62%
jan 1, 2015
59.537
-0.432
-0.72%
jan 1, 2016
61.049
+1.512
2.54%
jan 1, 2017
61.049
+0.0
0.0%
Ranking of countries by current statistics by years