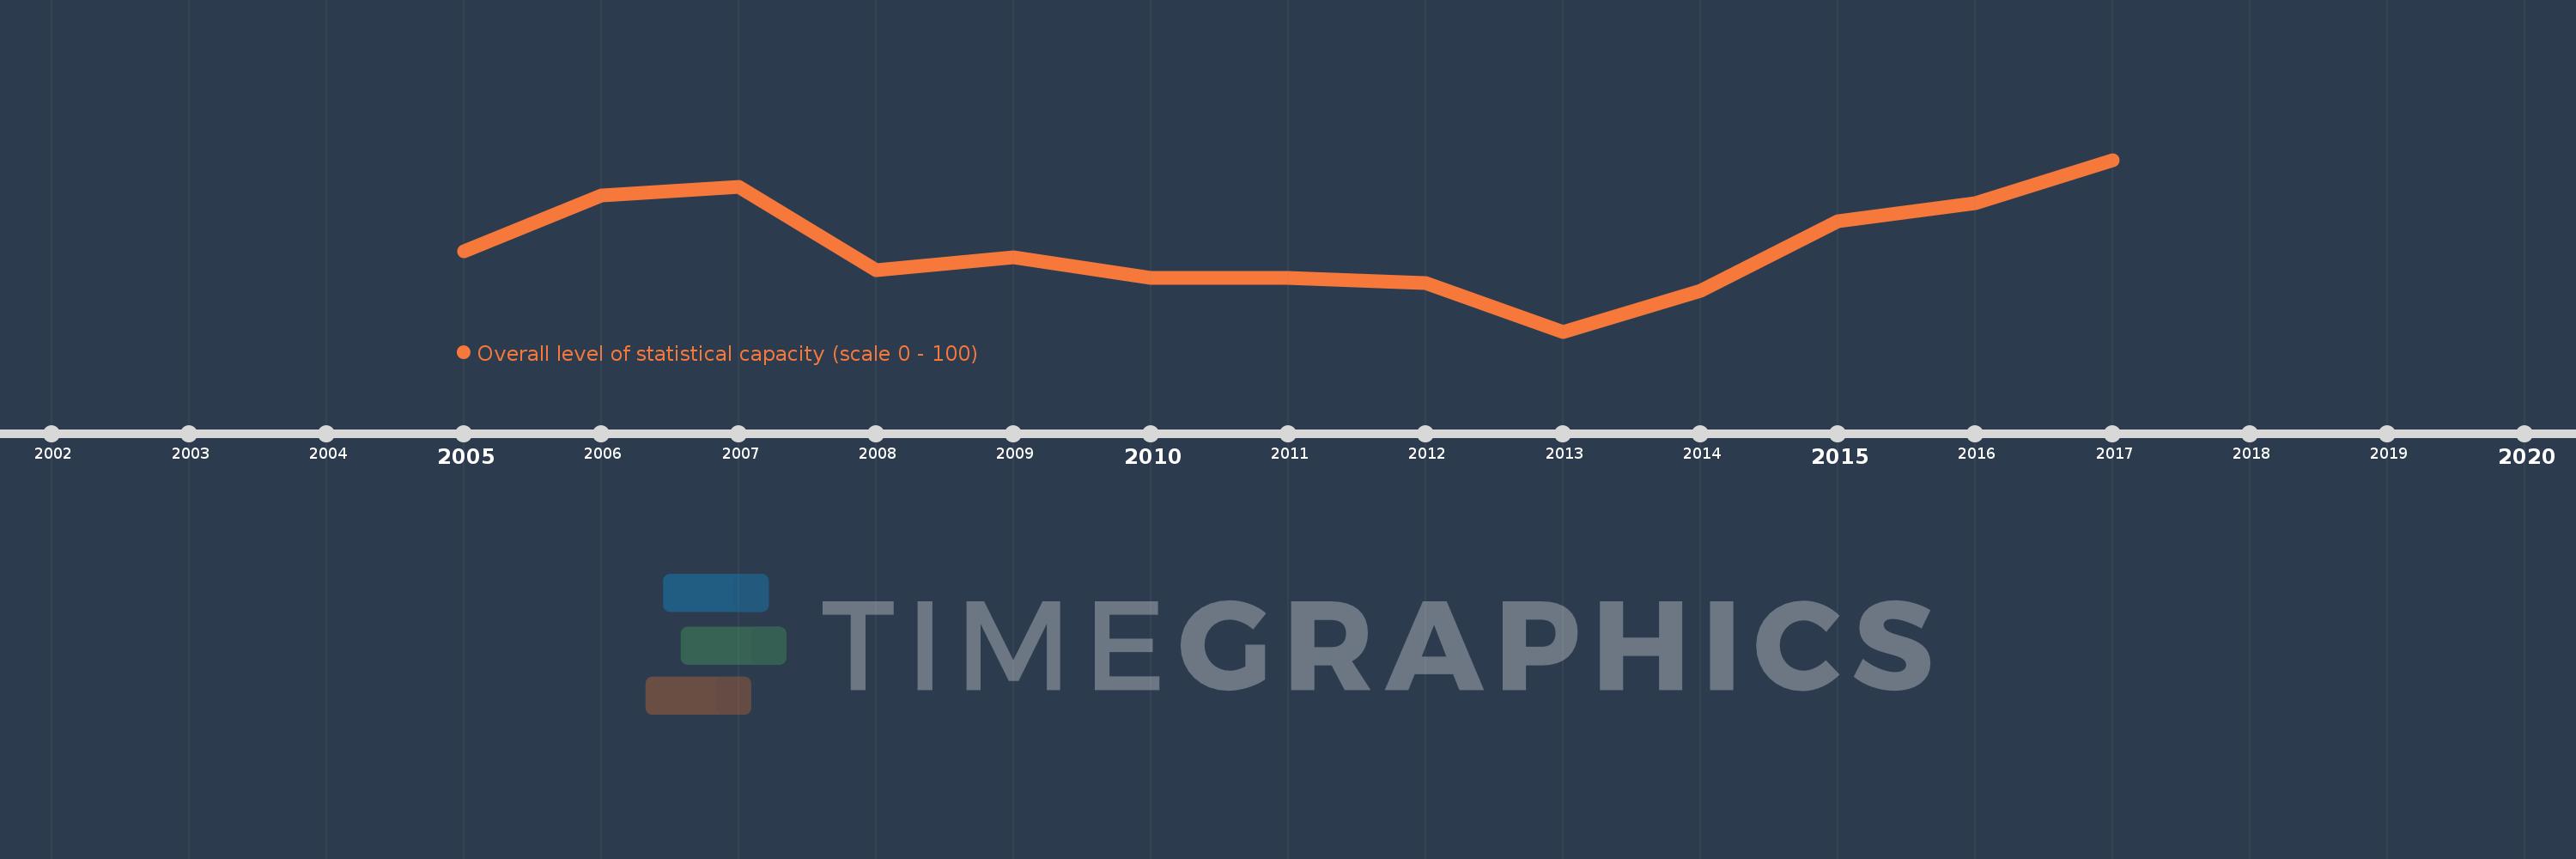
This timeline shows a graph from 2005 to 2017 of East Asia & Pacific (excluding high income). No data until 2004. Number of actual observations by date: 13.
Source name:
World Development Indicators
Source organization:
World Bank
Categories, topics:
Public Sector
Last updated:
apr 23, 2017
Indicators value changes by year
Meaning:
70.475
Minimum:
67.407
jan 1, 2013
Maximum:
73.611
jan 1, 2017
At the date of observation
Value
Absolute change
Change from the previous value
jan 1, 2005
70.303
+70.303
0.0%
jan 1, 2006
72.323
+2.02
2.87%
jan 1, 2007
72.626
+0.303
0.42%
jan 1, 2008
69.63
-2.997
-4.13%
jan 1, 2009
70.093
+0.463
0.66%
jan 1, 2010
69.352
-0.741
-1.06%
jan 1, 2011
69.352
0.0
0.0%
jan 1, 2012
69.167
-0.185
-0.27%
jan 1, 2013
67.407
-1.759
-2.54%
jan 1, 2014
68.889
+1.481
2.2%
jan 1, 2015
71.389
+2.5
3.63%
jan 1, 2016
72.037
+0.648
0.91%
jan 1, 2017
73.611
+1.574
2.19%
Ranking of countries by current statistics by years