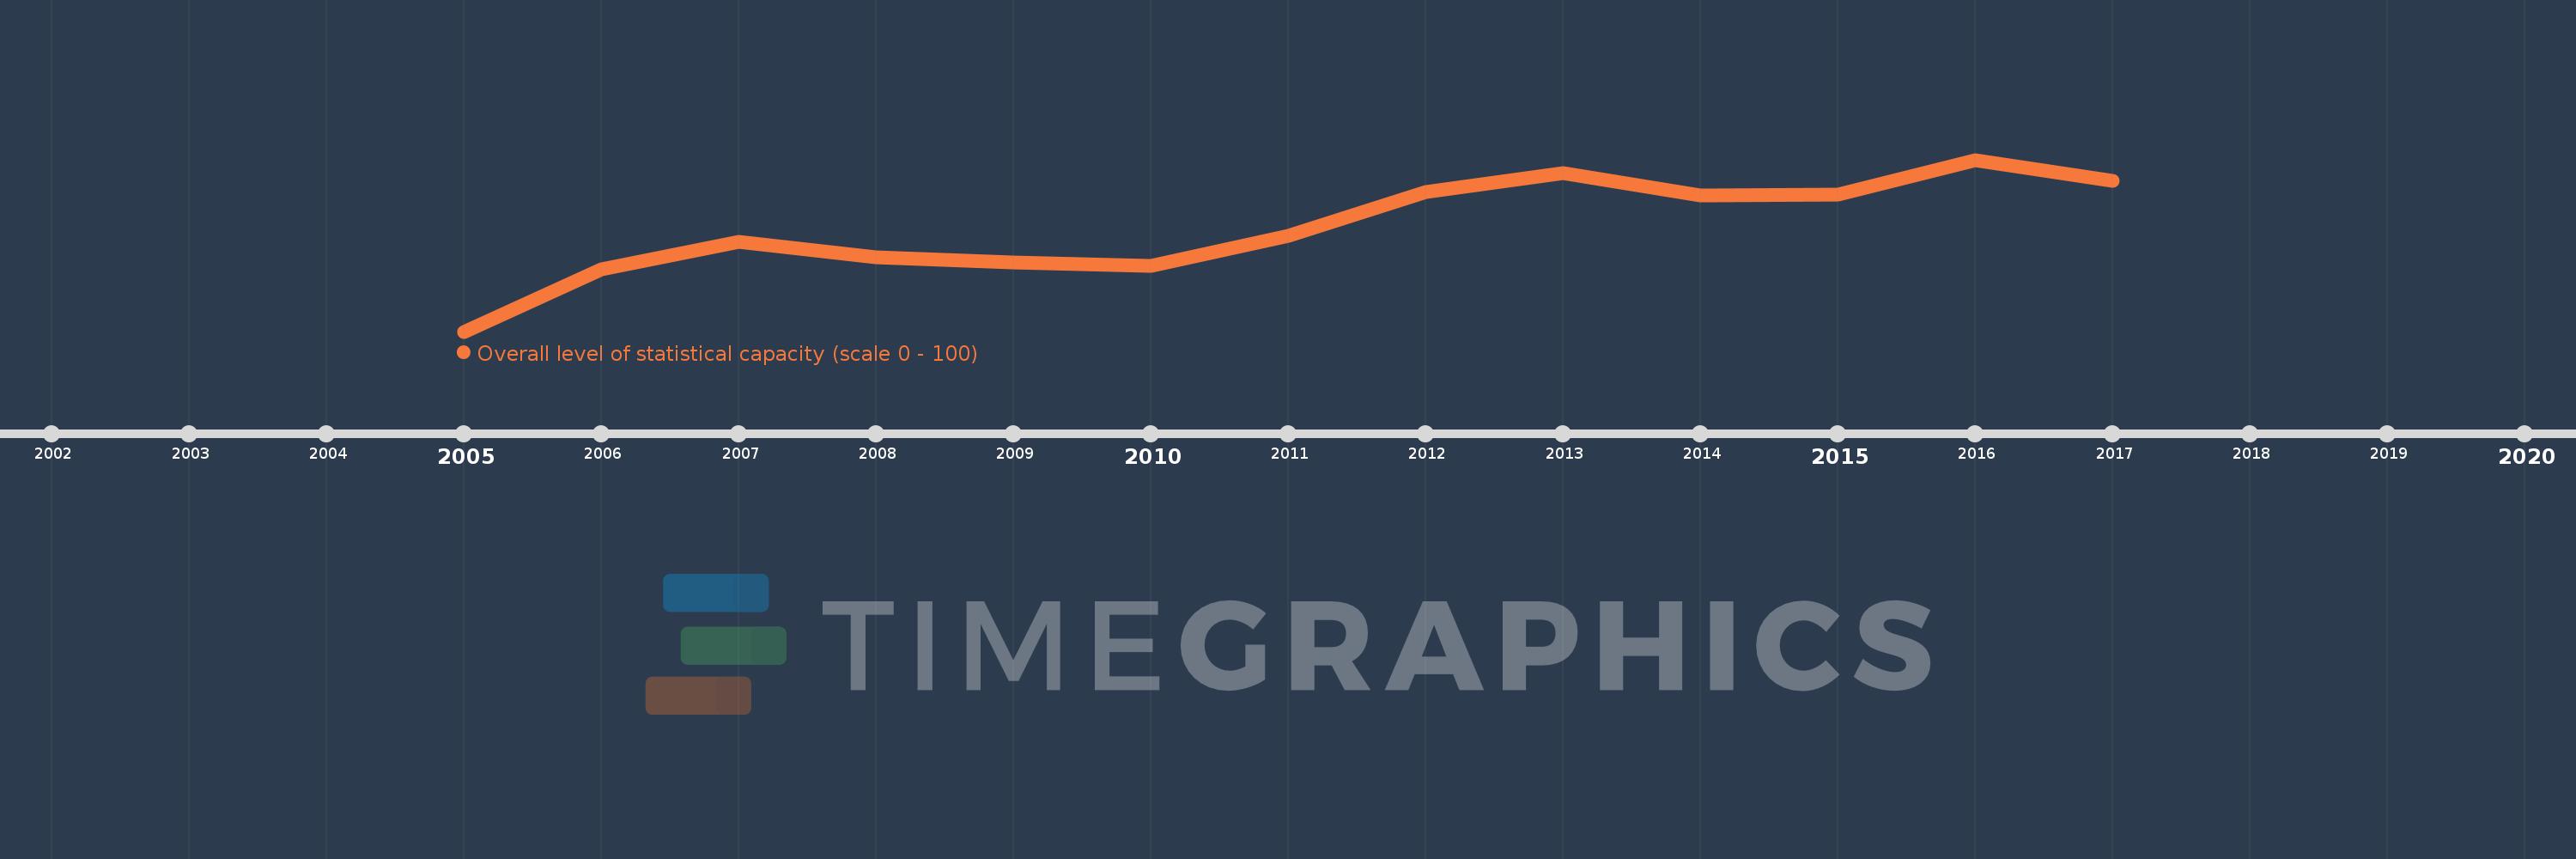
This timeline shows a graph from 2005 to 2017 of Fragile and conflict affected situations. No data until 2004. Number of actual observations by date: 13.
Source name:
World Development Indicators
Source organization:
World Bank
Categories, topics:
Public Sector
Last updated:
apr 23, 2017
Indicators value changes by year
Meaning:
49.225
Minimum:
44.578
jan 1, 2005
Maximum:
52.262
jan 1, 2016
At the date of observation
Value
Absolute change
Change from the previous value
jan 1, 2005
44.578
+44.578
0.0%
jan 1, 2006
47.378
+2.8
6.28%
jan 1, 2007
48.578
+1.2
2.53%
jan 1, 2008
47.911
-0.667
-1.37%
jan 1, 2009
47.689
-0.222
-0.46%
jan 1, 2010
47.521
-0.168
-0.35%
jan 1, 2011
48.868
+1.346
2.83%
jan 1, 2012
50.812
+1.944
3.98%
jan 1, 2013
51.667
+0.855
1.68%
jan 1, 2014
50.655
-1.012
-1.96%
jan 1, 2015
50.694
+0.04
0.08%
jan 1, 2016
52.262
+1.567
3.09%
jan 1, 2017
51.31
-0.952
-1.82%
Ranking of countries by current statistics by years