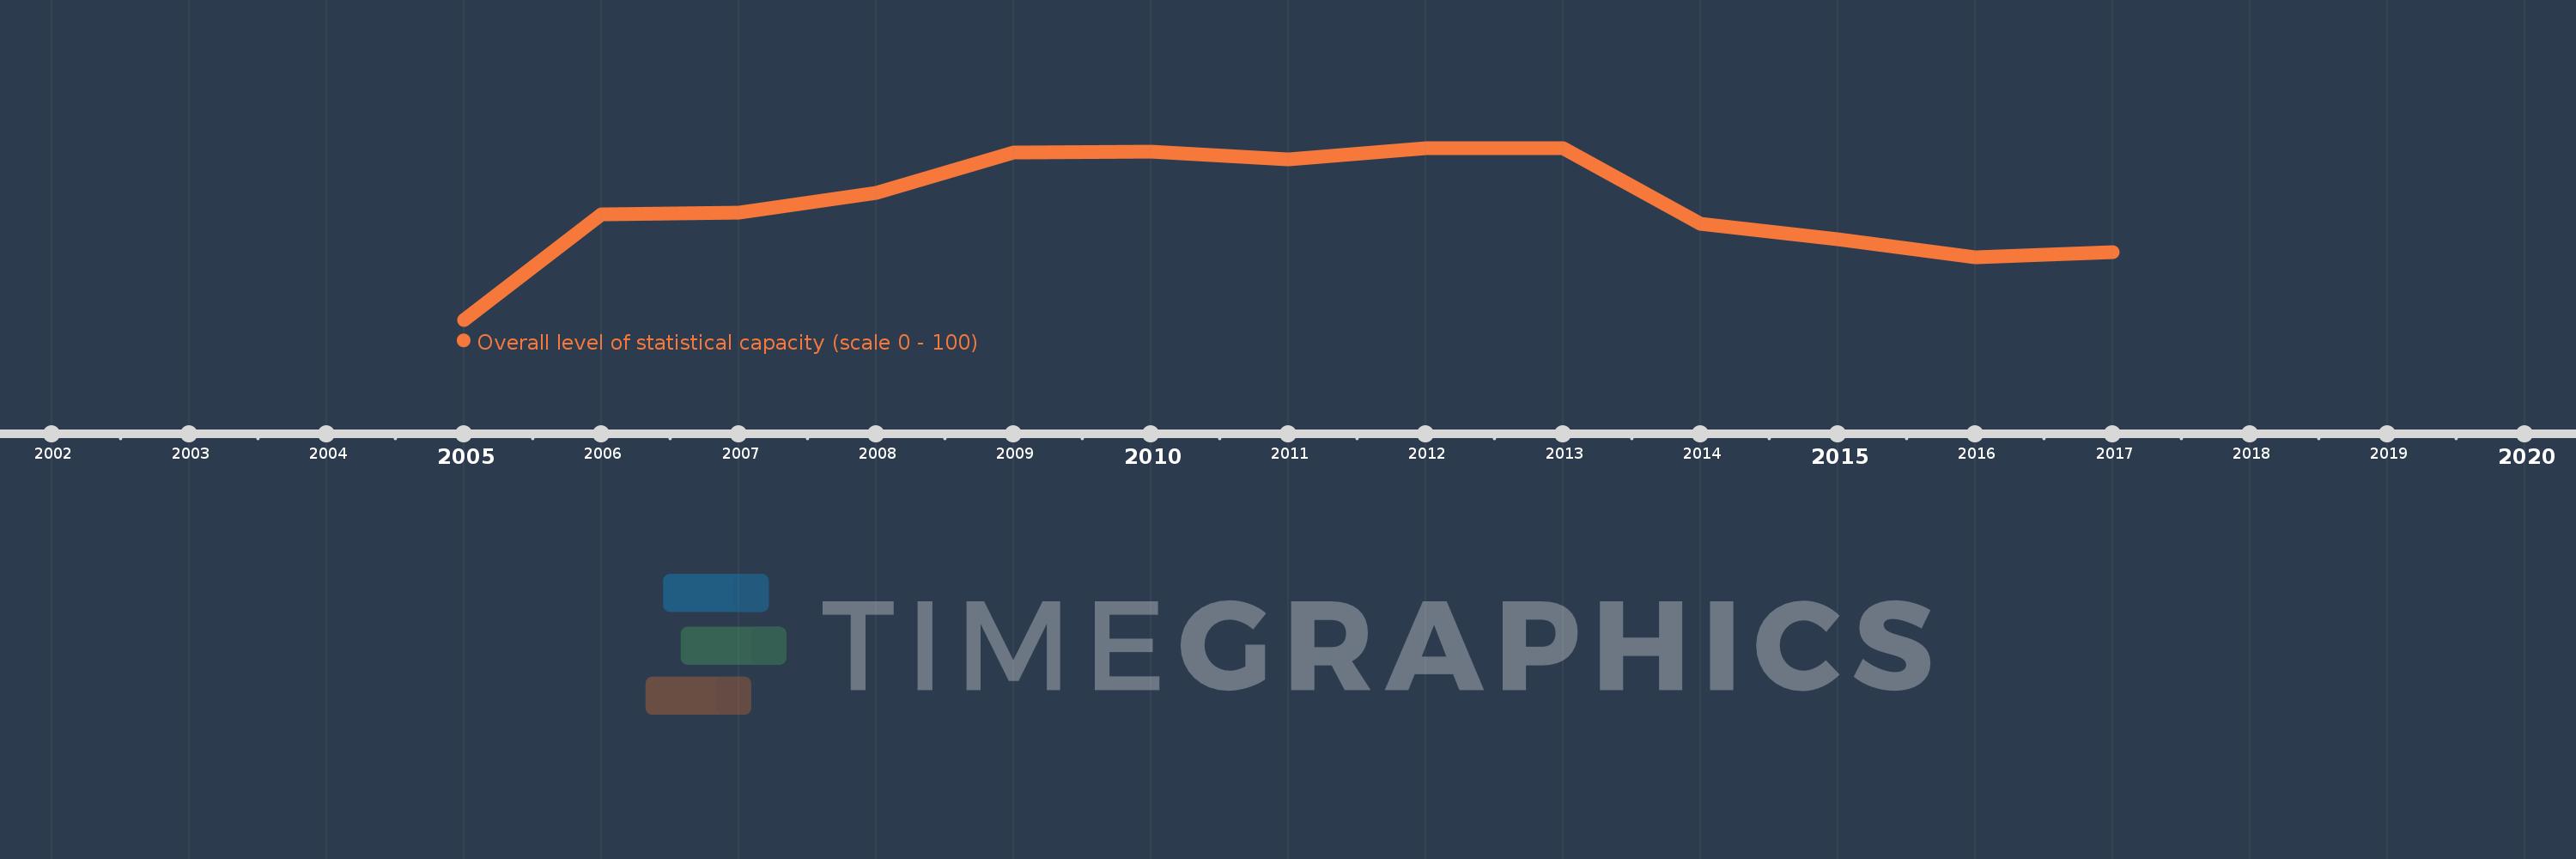
This timeline shows a graph from 2005 to 2017 of Europe & Central Asia (IDA & IBRD countries). No data until 2004. Number of actual observations by date: 13.
Source name:
World Development Indicators
Source organization:
World Bank
Categories, topics:
Public Sector
Last updated:
apr 23, 2017
Indicators value changes by year
Meaning:
79.428
Minimum:
75.767
jan 1, 2005
Maximum:
81.27
jan 1, 2012
At the date of observation
Value
Absolute change
Change from the previous value
jan 1, 2005
75.767
+75.767
0.0%
jan 1, 2006
79.153
+3.386
4.47%
jan 1, 2007
79.206
+0.053
0.07%
jan 1, 2008
79.841
+0.635
0.8%
jan 1, 2009
81.111
+1.27
1.59%
jan 1, 2010
81.164
+0.053
0.07%
jan 1, 2011
80.899
-0.265
-0.33%
jan 1, 2012
81.27
+0.37
0.46%
jan 1, 2013
81.27
0.0
0.0%
jan 1, 2014
78.838
-2.431
-2.99%
jan 1, 2015
78.338
-0.5
-0.63%
jan 1, 2016
77.778
-0.561
-0.72%
jan 1, 2017
77.929
+0.152
0.19%
Ranking of countries by current statistics by years