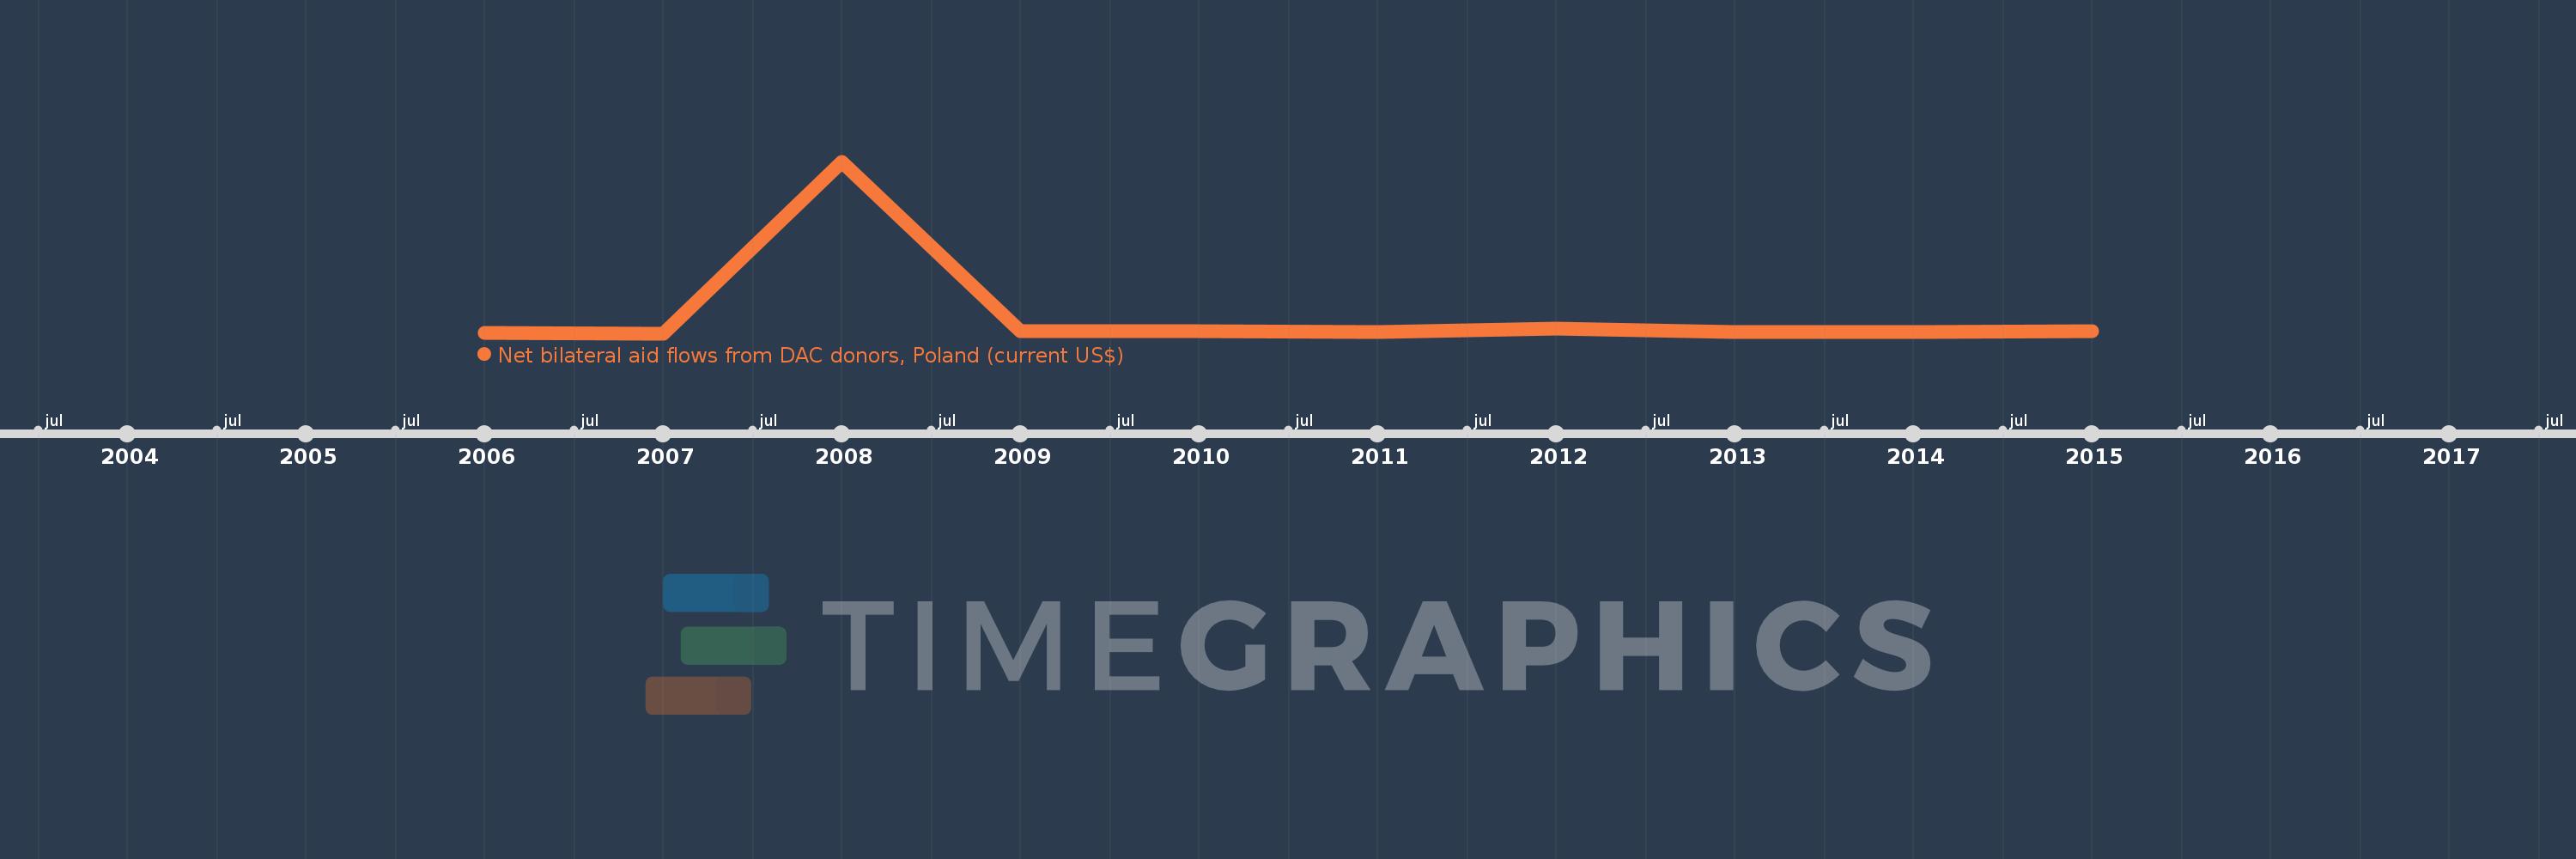
This timeline shows a graph from 2006 to 2015 of Latin America & the Caribbean (IDA & IBRD countries). No data until 2005. Number of actual observations by date: 10.
Source name:
World Development Indicators
Source organization:
Development Assistance Committee of the Organisation for Economic Co-operation and Development, Geographical Distribution of Financial Flows to Developing Countries, Development Co-operation Report, and International Development Statistics database. Data are available online at: www.oecd.org/dac/stats/idsonline.
Categories, topics:
Aid Effectiveness
Last updated:
apr 23, 2017
Indicators value changes by year
Meaning:
3.539 mln
Minimum:
130.0K
jan 1, 2007
Maximum:
31.31 mln
jan 1, 2008
At the date of observation
Value
Absolute change
Change from the previous value
jan 1, 2006
270.0K
+270.0K
0.0%
jan 1, 2007
130.0K
-140.0K
-51.85%
jan 1, 2008
31.31 mln
+31.18 mln
23.98K%
jan 1, 2009
460.0K
-30.85 mln
-98.53%
jan 1, 2010
510.0K
+50.0K
10.87%
jan 1, 2011
440.0K
-70.0K
-13.73%
jan 1, 2012
980.0K
+540.0K
122.73%
jan 1, 2013
420.0K
-560.0K
-57.14%
jan 1, 2014
410.0K
-10.0K
-2.38%
jan 1, 2015
460.0K
+50.0K
12.2%
Ranking of countries by current statistics by years