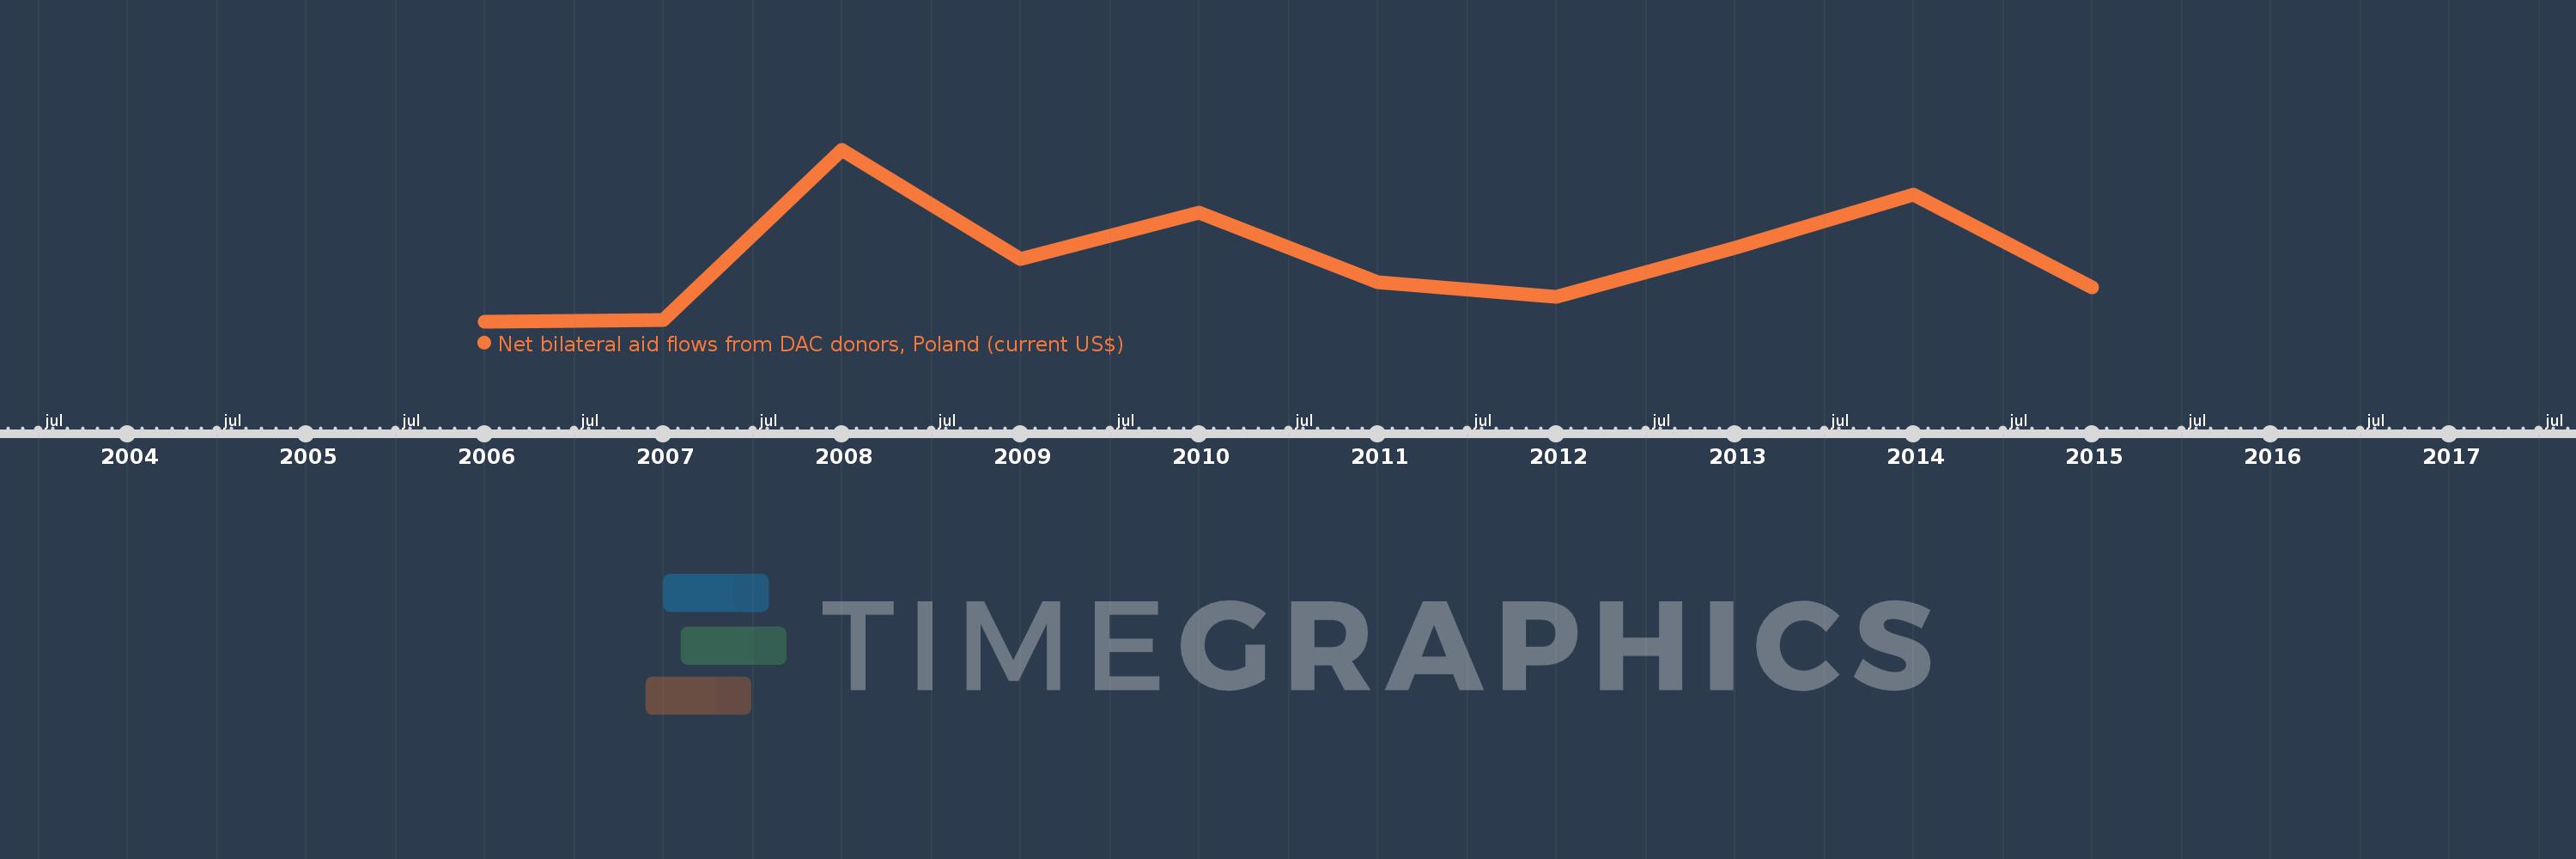
This timeline shows a graph from 2006 to 2015 of Tanzania. No data until 2005. Number of actual observations by date: 10.
Source name:
World Development Indicators
Source organization:
Development Assistance Committee of the Organisation for Economic Co-operation and Development, Geographical Distribution of Financial Flows to Developing Countries, Development Co-operation Report, and International Development Statistics database. Data are available online at: www.oecd.org/dac/stats/idsonline.
Categories, topics:
Aid Effectiveness
Last updated:
apr 23, 2017
Indicators value changes by year
Meaning:
339.0K
Minimum:
60.0K
jan 1, 2006
Maximum:
800.0K
jan 1, 2008
At the date of observation
Value
Absolute change
Change from the previous value
jan 1, 2006
60.0K
+60.0K
0.0%
jan 1, 2007
70.0K
+10.0K
16.67%
jan 1, 2008
800.0K
+730.0K
1.04K%
jan 1, 2009
330.0K
-470.0K
-58.75%
jan 1, 2010
530.0K
+200.0K
60.61%
jan 1, 2011
230.0K
-300.0K
-56.6%
jan 1, 2012
170.0K
-60.0K
-26.09%
jan 1, 2013
380.0K
+210.0K
123.53%
jan 1, 2014
610.0K
+230.0K
60.53%
jan 1, 2015
210.0K
-400.0K
-65.57%
Ranking of countries by current statistics by years