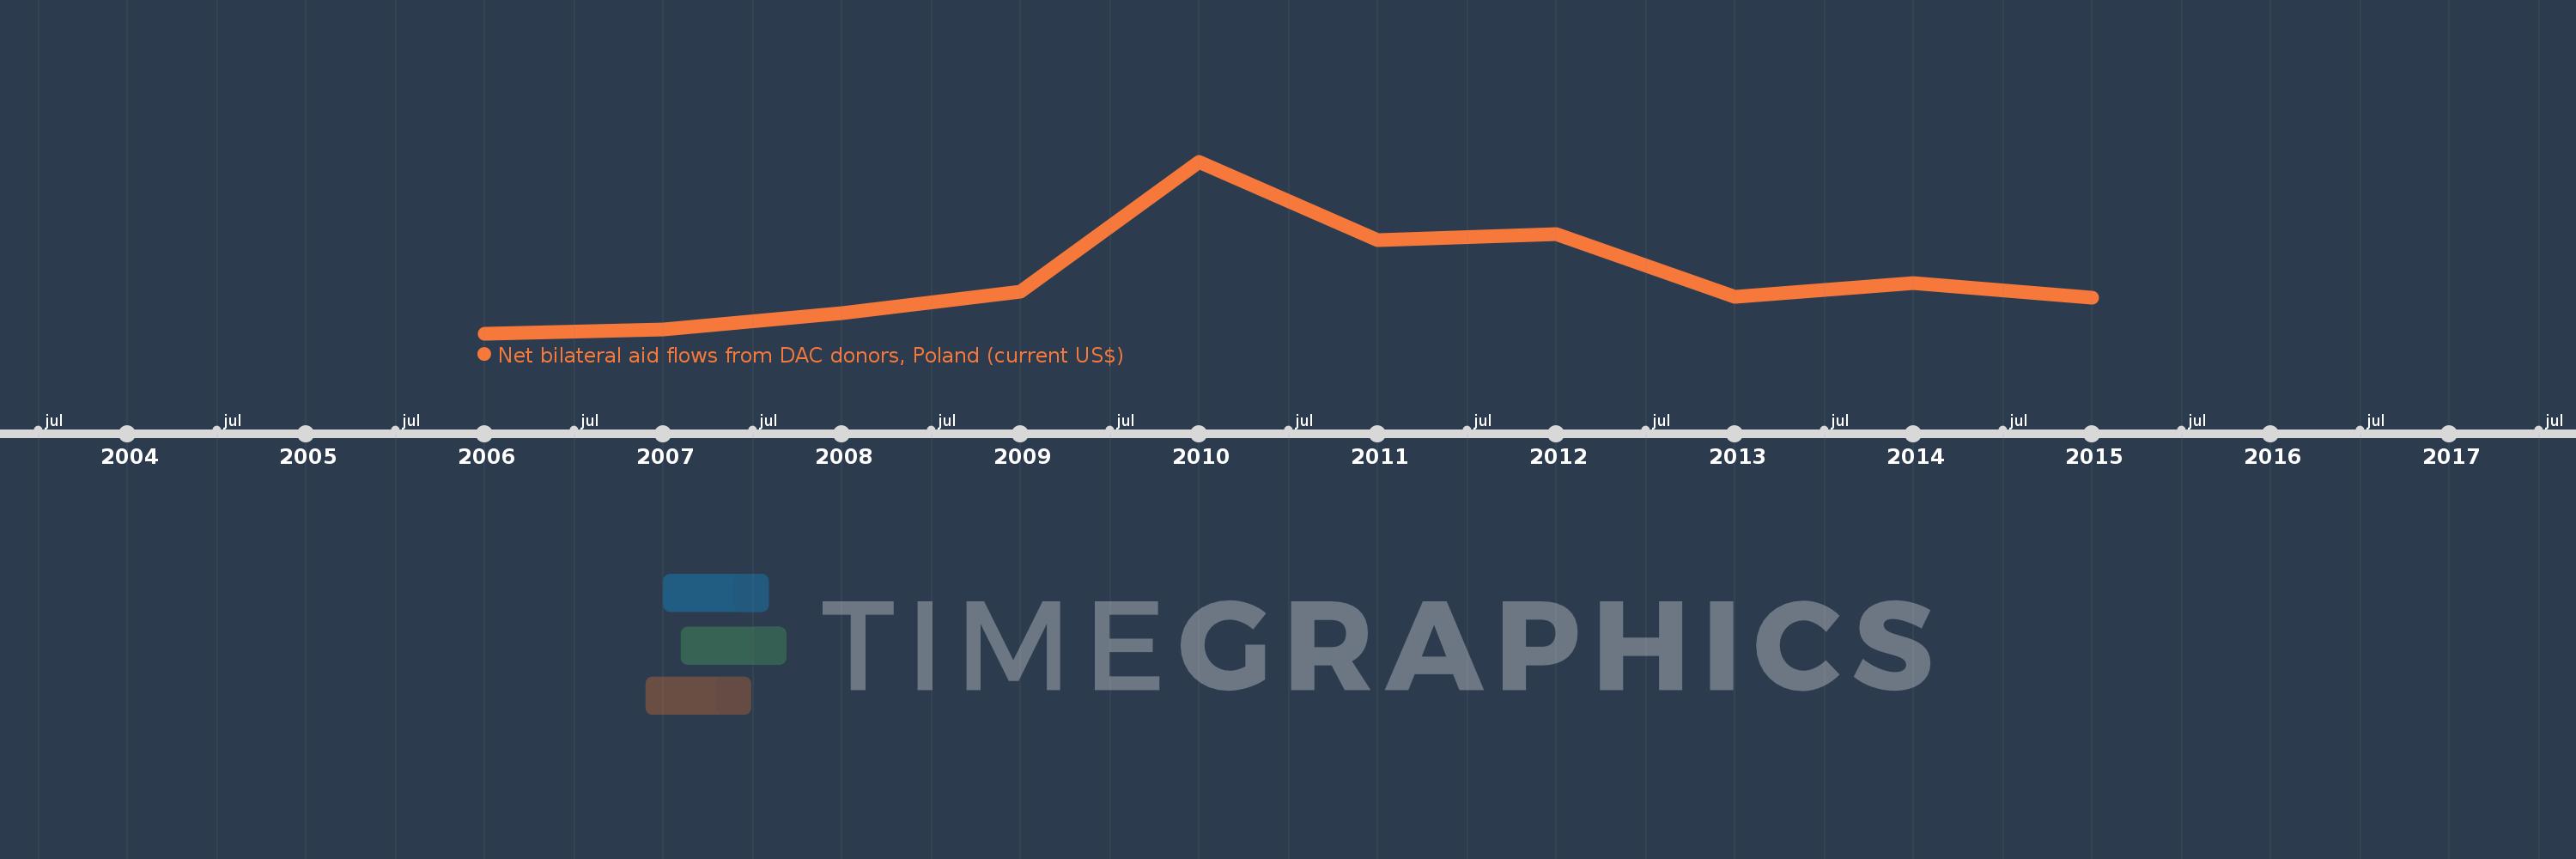
This timeline shows a graph from 2006 to 2015 of Georgia. No data until 2005. Number of actual observations by date: 10.
Source name:
World Development Indicators
Source organization:
Development Assistance Committee of the Organisation for Economic Co-operation and Development, Geographical Distribution of Financial Flows to Developing Countries, Development Co-operation Report, and International Development Statistics database. Data are available online at: www.oecd.org/dac/stats/idsonline.
Categories, topics:
Aid Effectiveness
Last updated:
apr 23, 2017
Indicators value changes by year
Meaning:
3.773 mln
Minimum:
250.0K
jan 1, 2006
Maximum:
11.19 mln
jan 1, 2010
At the date of observation
Value
Absolute change
Change from the previous value
jan 1, 2006
250.0K
+250.0K
0.0%
jan 1, 2007
520.0K
+270.0K
108.0%
jan 1, 2008
1.55 mln
+1.03 mln
198.08%
jan 1, 2009
2.88 mln
+1.33 mln
85.81%
jan 1, 2010
11.19 mln
+8.31 mln
288.54%
jan 1, 2011
6.19 mln
-5.0 mln
-44.68%
jan 1, 2012
6.58 mln
+390.0K
6.3%
jan 1, 2013
2.58 mln
-4.0 mln
-60.79%
jan 1, 2014
3.45 mln
+870.0K
33.72%
jan 1, 2015
2.54 mln
-910.0K
-26.38%
Ranking of countries by current statistics by years