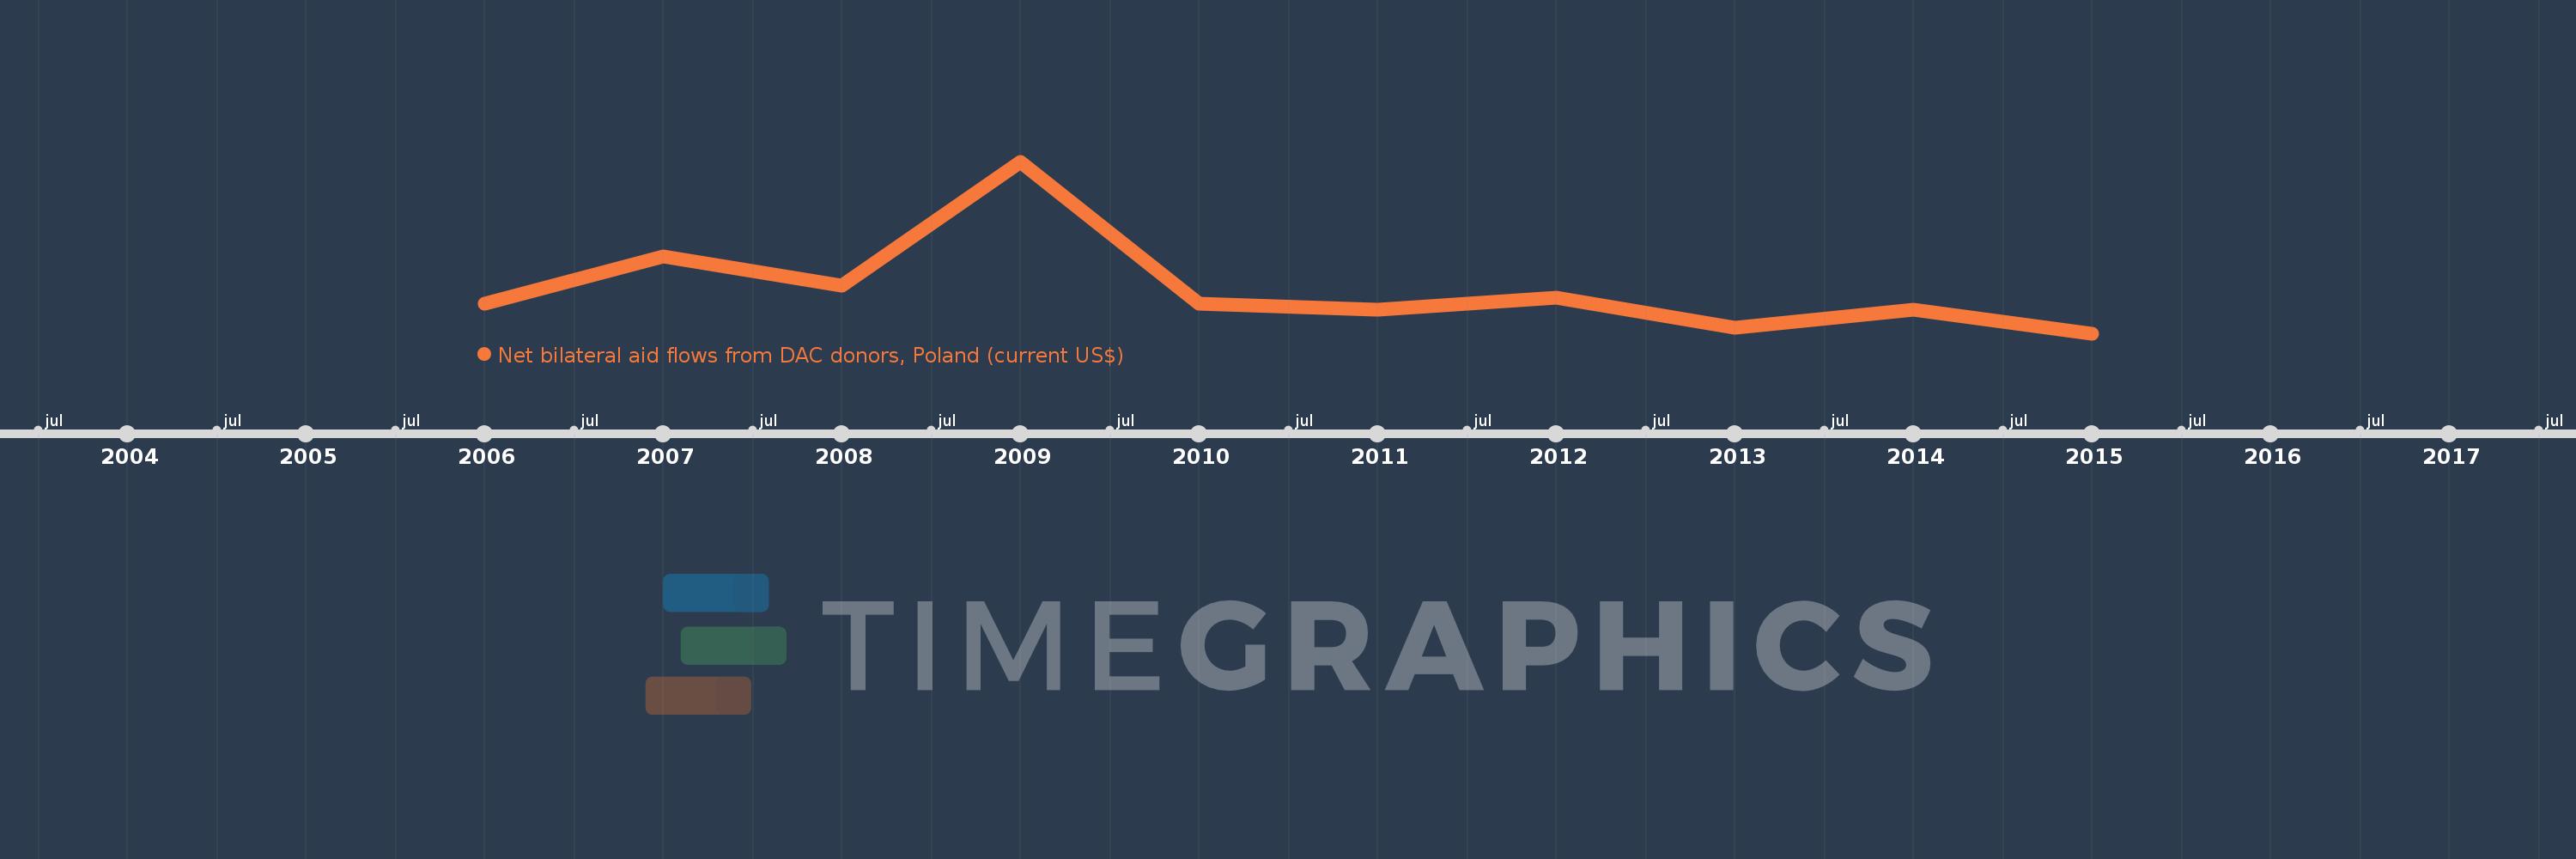
This timeline shows a graph from 2006 to 2015 of Congo, Dem. Rep.. No data until 2005. Number of actual observations by date: 10.
Source name:
World Development Indicators
Source organization:
Development Assistance Committee of the Organisation for Economic Co-operation and Development, Geographical Distribution of Financial Flows to Developing Countries, Development Co-operation Report, and International Development Statistics database. Data are available online at: www.oecd.org/dac/stats/idsonline.
Categories, topics:
Aid Effectiveness
Last updated:
apr 23, 2017
Indicators value changes by year
Meaning:
85.0K
Minimum:
10.0K
jan 1, 2015
Maximum:
300.0K
jan 1, 2009
At the date of observation
Value
Absolute change
Change from the previous value
jan 1, 2006
60.0K
+60.0K
0.0%
jan 1, 2007
140.0K
+80.0K
133.33%
jan 1, 2008
90.0K
-50.0K
-35.71%
jan 1, 2009
300.0K
+210.0K
233.33%
jan 1, 2010
60.0K
-240.0K
-80.0%
jan 1, 2011
50.0K
-10.0K
-16.67%
jan 1, 2012
70.0K
+20.0K
40.0%
jan 1, 2013
20.0K
-50.0K
-71.43%
jan 1, 2014
50.0K
+30.0K
150.0%
jan 1, 2015
10.0K
-40.0K
-80.0%
Ranking of countries by current statistics by years