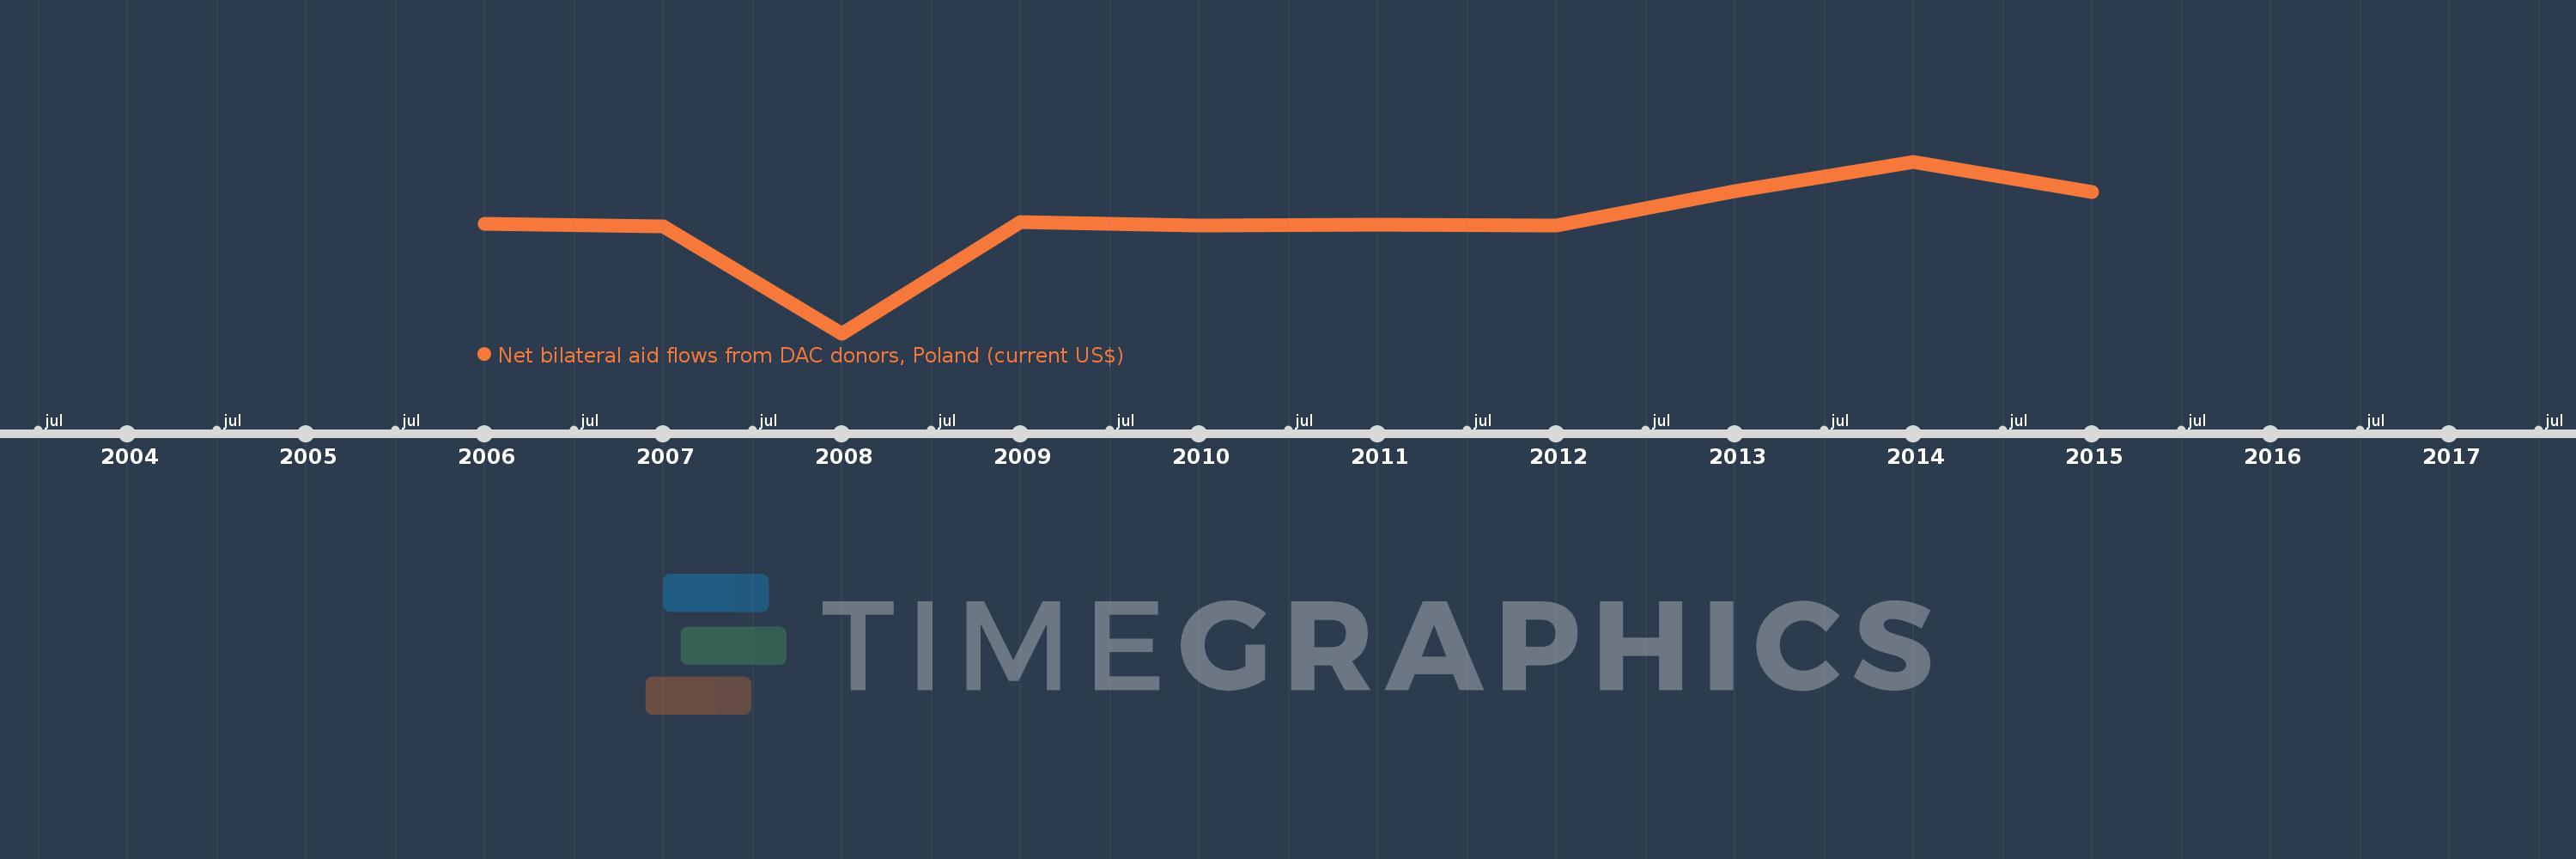
This timeline shows a graph from 2006 to 2015 of Syrian Arab Republic. No data until 2005. Number of actual observations by date: 10.
Source name:
World Development Indicators
Source organization:
Development Assistance Committee of the Organisation for Economic Co-operation and Development, Geographical Distribution of Financial Flows to Developing Countries, Development Co-operation Report, and International Development Statistics database. Data are available online at: www.oecd.org/dac/stats/idsonline.
Categories, topics:
Aid Effectiveness
Last updated:
apr 23, 2017
Indicators value changes by year
Meaning:
177.0K
Minimum:
-4.06 mln
jan 1, 2008
Maximum:
2.52 mln
jan 1, 2014
At the date of observation
Value
Absolute change
Change from the previous value
jan 1, 2006
130.0K
+130.0K
0.0%
jan 1, 2007
30.0K
-100.0K
-76.92%
jan 1, 2008
-4.06 mln
-4.09 mln
-13.63K%
jan 1, 2009
190.0K
+4.25 mln
-104.68%
jan 1, 2010
80.0K
-110.0K
-57.89%
jan 1, 2011
100.0K
+20.0K
25.0%
jan 1, 2012
70.0K
-30.0K
-30.0%
jan 1, 2013
1.37 mln
+1.3 mln
1.86K%
jan 1, 2014
2.52 mln
+1.15 mln
83.94%
jan 1, 2015
1.34 mln
-1.18 mln
-46.83%
Ranking of countries by current statistics by years