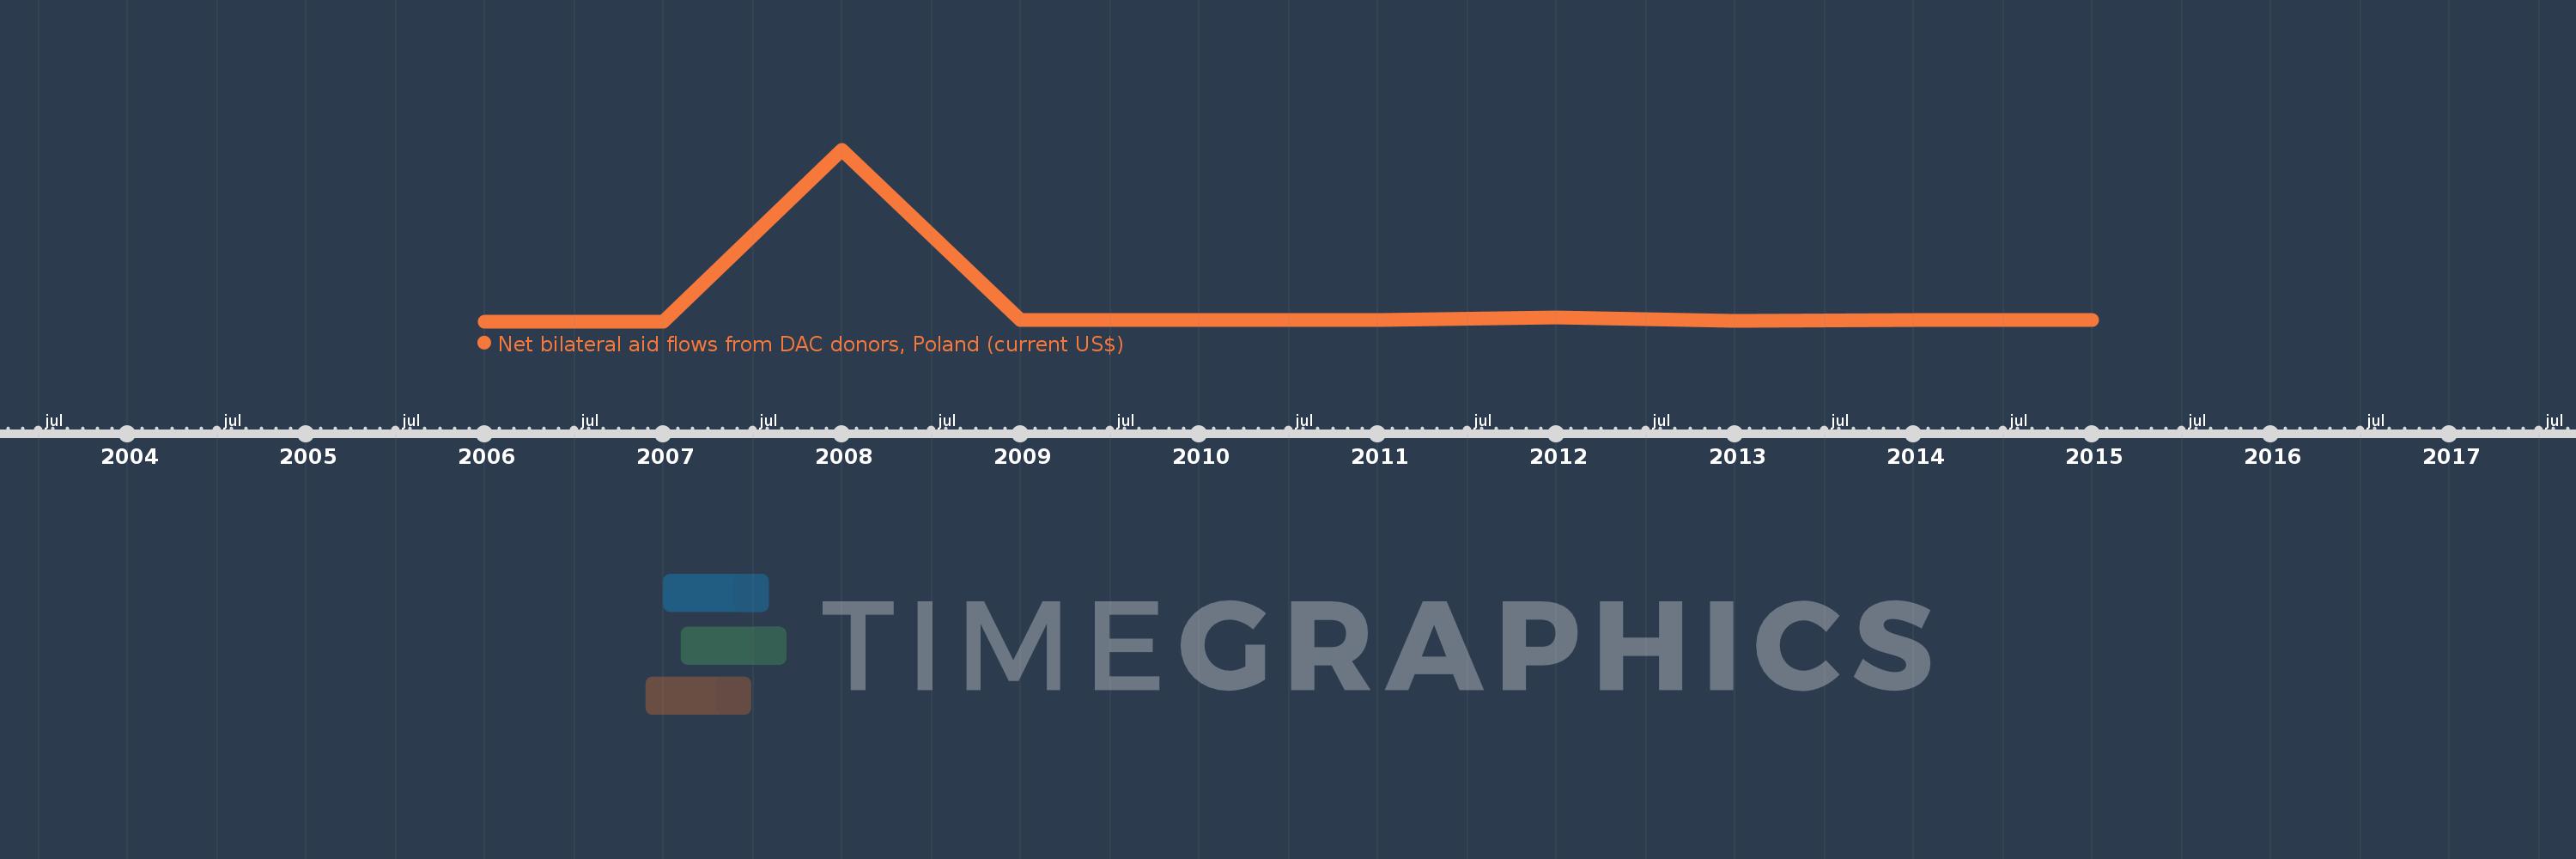
This timeline shows a graph from 2006 to 2015 of Latin America & Caribbean (excluding high income). No data until 2005. Number of actual observations by date: 10.
Source name:
World Development Indicators
Source organization:
Development Assistance Committee of the Organisation for Economic Co-operation and Development, Geographical Distribution of Financial Flows to Developing Countries, Development Co-operation Report, and International Development Statistics database. Data are available online at: www.oecd.org/dac/stats/idsonline.
Categories, topics:
Aid Effectiveness
Last updated:
apr 23, 2017
Indicators value changes by year
Meaning:
3.566 mln
Minimum:
150.0K
jan 1, 2007
Maximum:
31.31 mln
jan 1, 2008
At the date of observation
Value
Absolute change
Change from the previous value
jan 1, 2006
270.0K
+270.0K
0.0%
jan 1, 2007
150.0K
-120.0K
-44.44%
jan 1, 2008
31.31 mln
+31.16 mln
20.77K%
jan 1, 2009
550.0K
-30.76 mln
-98.24%
jan 1, 2010
560.0K
+10.0K
1.82%
jan 1, 2011
470.0K
-90.0K
-16.07%
jan 1, 2012
1.01 mln
+540.0K
114.89%
jan 1, 2013
430.0K
-580.0K
-57.43%
jan 1, 2014
440.0K
+10.0K
2.33%
jan 1, 2015
470.0K
+30.0K
6.82%
Ranking of countries by current statistics by years