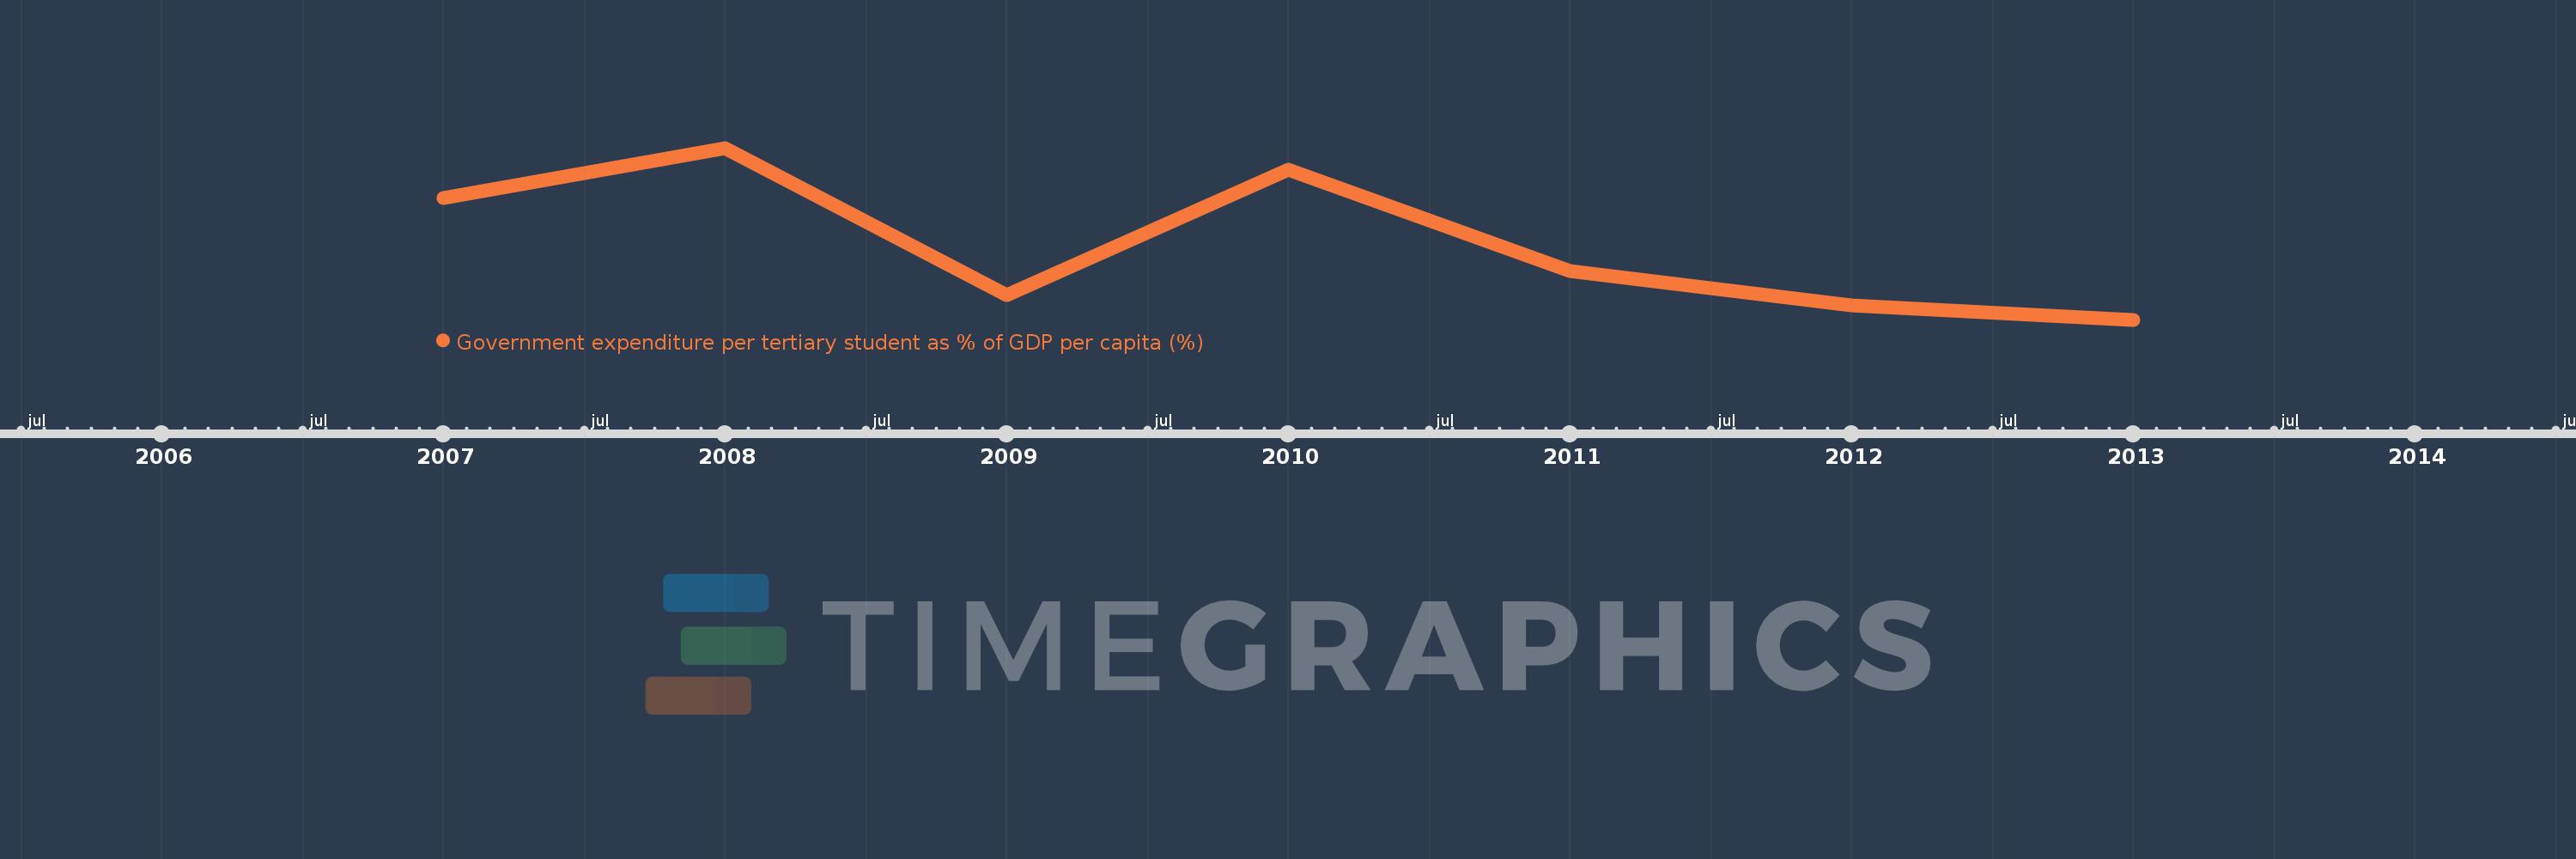
This timeline shows a graph from 2007 to 2013 of Europe & Central Asia (IDA & IBRD countries). No data until 2006. Number of actual observations by date: 7.
Source name:
World Development Indicators
Source organization:
UNESCO Institute for Statistics
Categories, topics:
Education
Last updated:
apr 23, 2017
Indicators value changes by year
Meaning:
20.241
Minimum:
18.353
jan 1, 2013
Maximum:
22.635
jan 1, 2008
At the date of observation
Value
Absolute change
Change from the previous value
jan 1, 2007
21.388
+21.388
0.0%
jan 1, 2008
22.635
+1.248
5.83%
jan 1, 2009
18.96
-3.675
-16.24%
jan 1, 2010
22.089
+3.128
16.5%
jan 1, 2011
19.557
-2.531
-11.46%
jan 1, 2012
18.709
-0.849
-4.34%
jan 1, 2013
18.353
-0.355
-1.9%
Ranking of countries by current statistics by years