Download This statistics in other country:
Timeline:
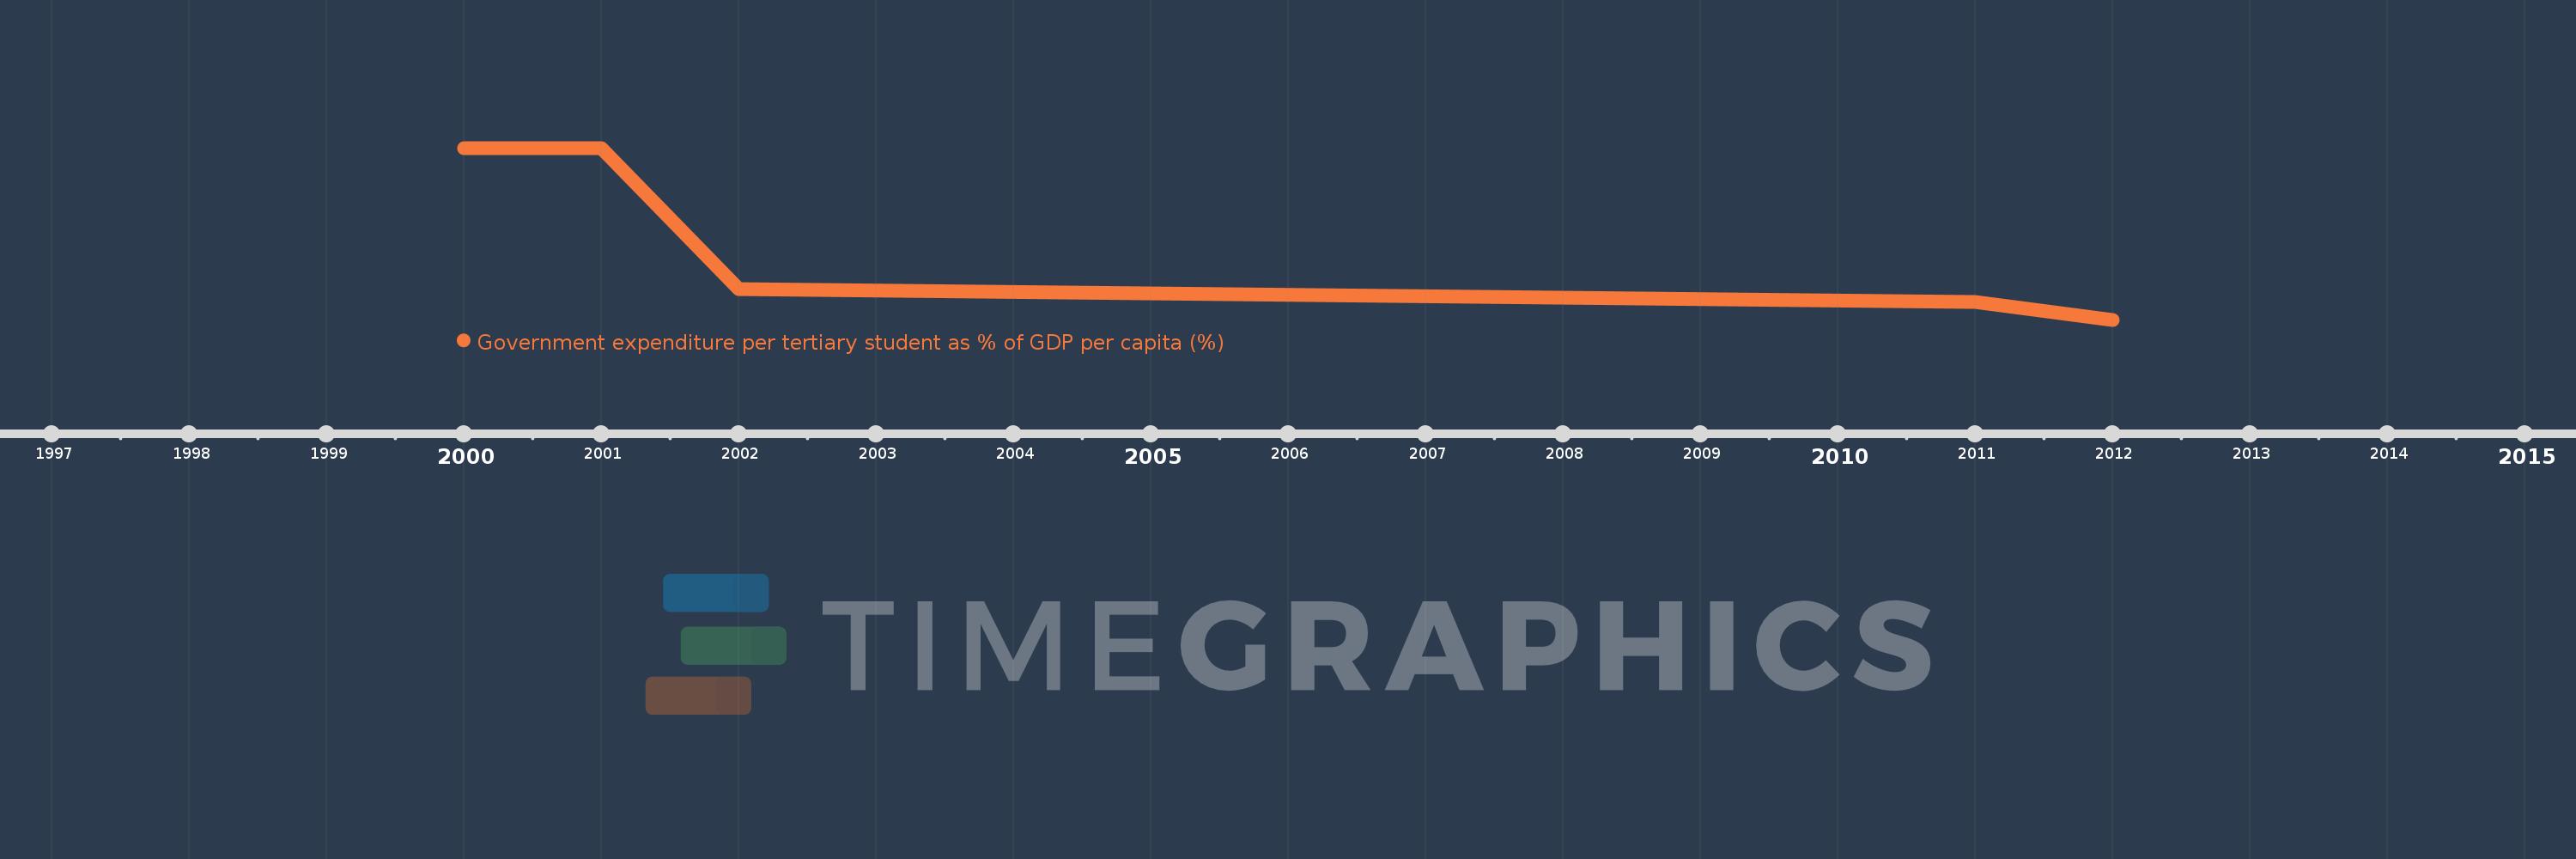
This timeline shows a graph from 2000 to 2012 of Malawi. No data until 1999. Number of actual observations by date: 5.
Source name:
World Development Indicators
Source organization:
UNESCO Institute for Statistics
Categories, topics:
Education
Last updated:
apr 23, 2017
Indicators value changes by year
Minimum:
1.725K
jan 1, 2012
Maximum:
2.494K
jan 1, 2001
At the date of observation
Value
Absolute change
Change from the previous value
jan 1, 2000
2.492K
+2.492K
0.0%
jan 1, 2001
2.494K
+1.208
0.05%
jan 1, 2002
1.864K
-629.167
-25.23%
jan 1, 2011
1.807K
-57.83
-3.1%
jan 1, 2012
1.725K
-81.126
-4.49%
Ranking of countries by current statistics by years