Download This statistics in other country:
Timeline:
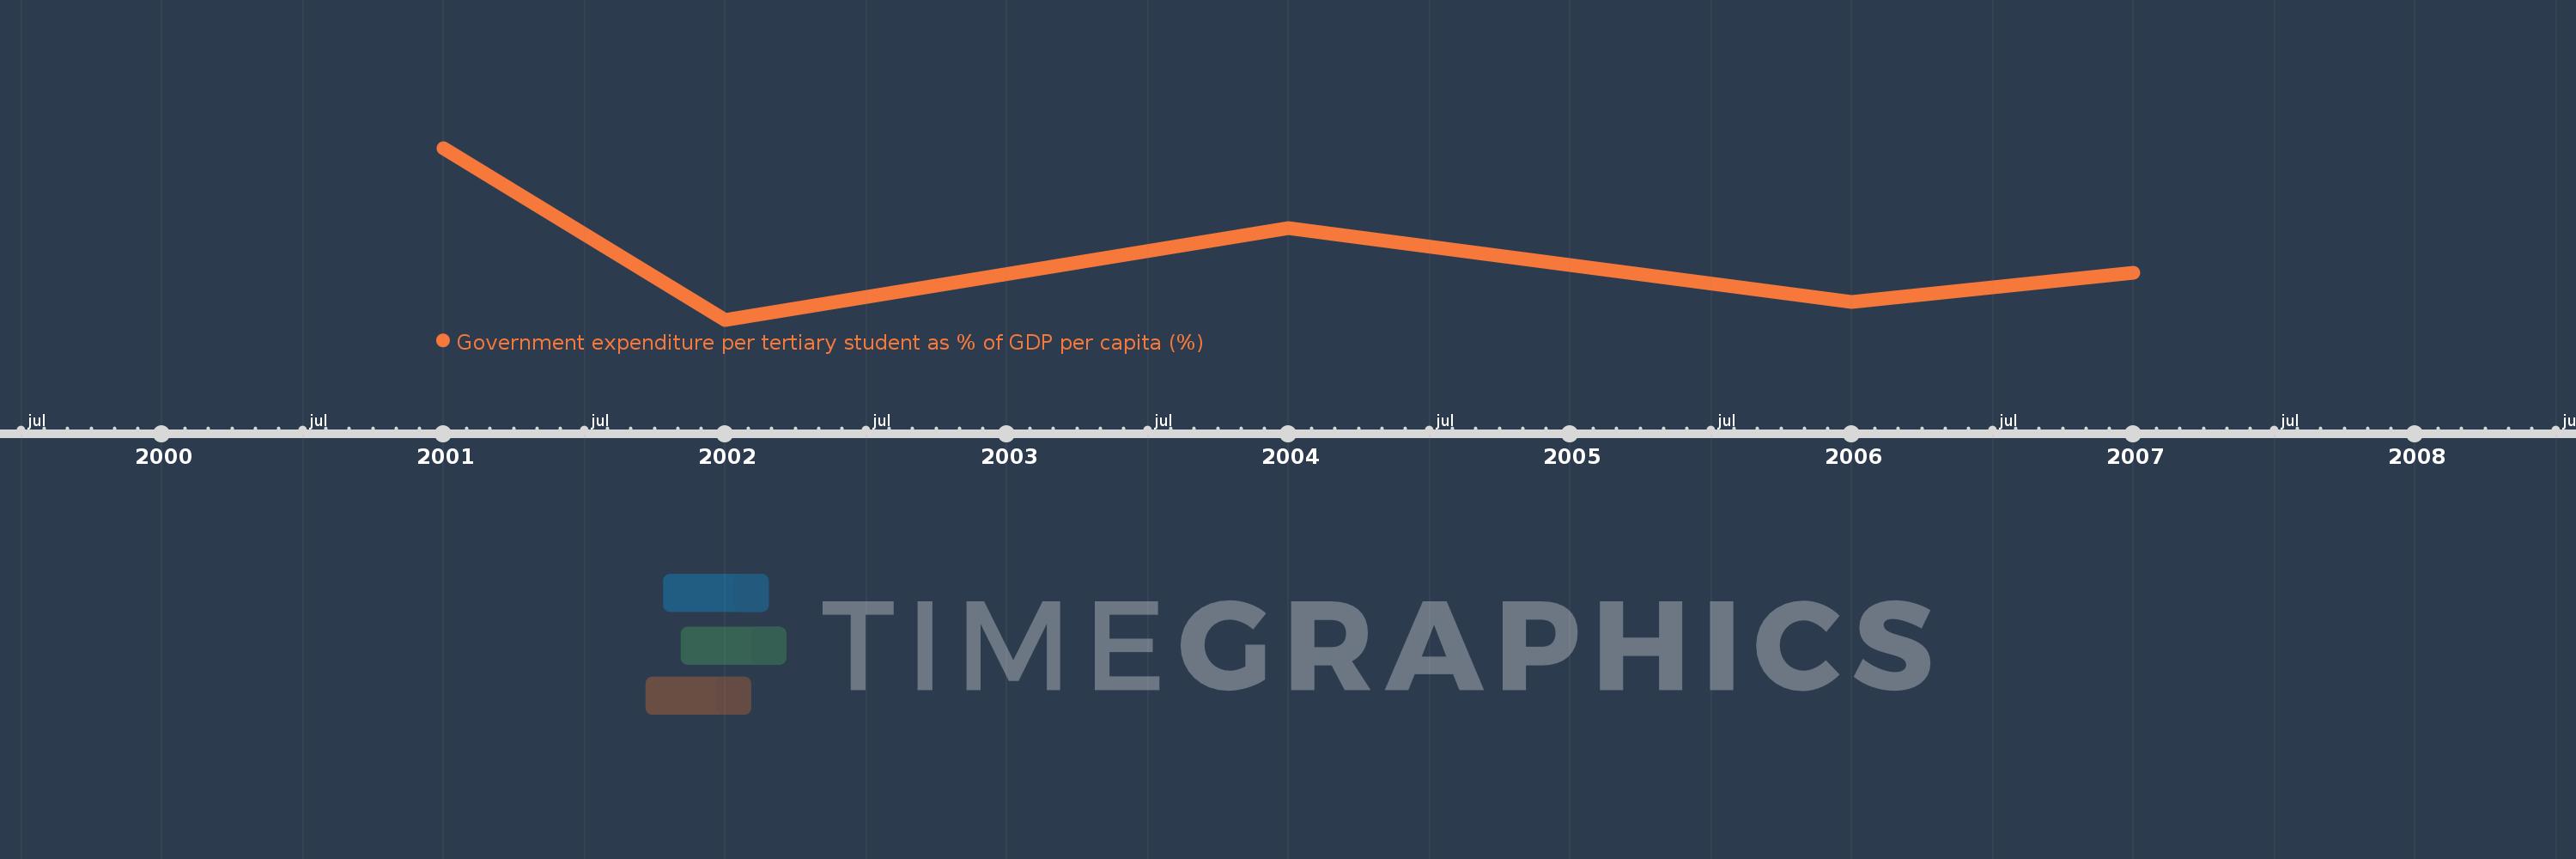
This timeline shows a graph from 2001 to 2007 of Swaziland. No data until 2000. Number of actual observations by date: 5.
Source name:
World Development Indicators
Source organization:
UNESCO Institute for Statistics
Categories, topics:
Education
Last updated:
apr 23, 2017
Indicators value changes by year
Minimum:
279.152
jan 1, 2002
Maximum:
434.872
jan 1, 2001
At the date of observation
Value
Absolute change
Change from the previous value
jan 1, 2001
434.872
+434.872
0.0%
jan 1, 2002
279.152
-155.719
-35.81%
jan 1, 2004
361.881
+82.729
29.64%
jan 1, 2006
294.954
-66.927
-18.49%
jan 1, 2007
321.851
+26.896
9.12%
Ranking of countries by current statistics by years