Download This statistics in other country:
Timeline:
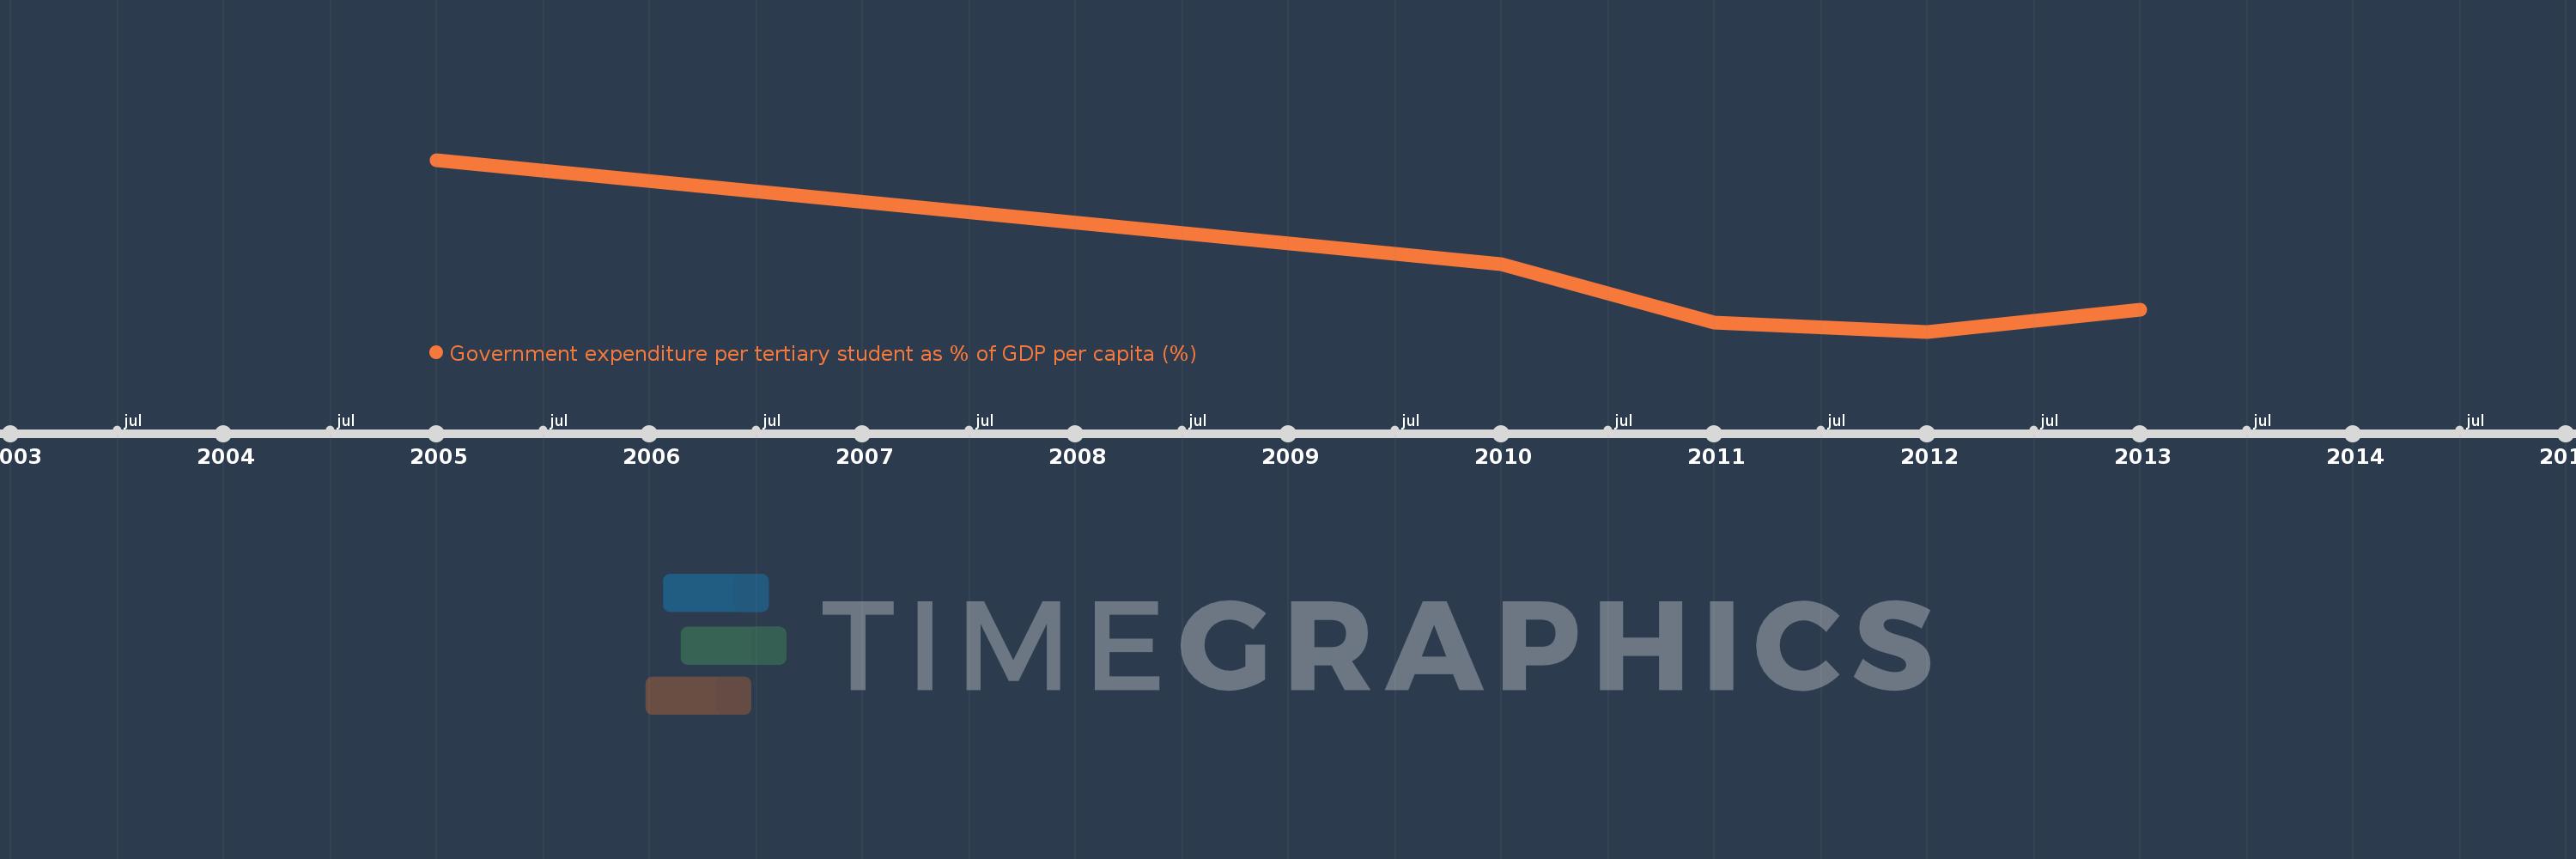
This timeline shows a graph from 2005 to 2013 of Uganda. No data until 2004. Number of actual observations by date: 5.
Source name:
World Development Indicators
Source organization:
UNESCO Institute for Statistics
Categories, topics:
Education
Last updated:
apr 23, 2017
Indicators value changes by year
Minimum:
61.679
jan 1, 2012
Maximum:
174.419
jan 1, 2005
At the date of observation
Value
Absolute change
Change from the previous value
jan 1, 2005
174.419
+174.419
0.0%
jan 1, 2010
105.903
-68.516
-39.28%
jan 1, 2011
67.668
-38.235
-36.1%
jan 1, 2012
61.679
-5.988
-8.85%
jan 1, 2013
76.269
+14.59
23.65%
Ranking of countries by current statistics by years