Download This statistics in other country:
Timeline:
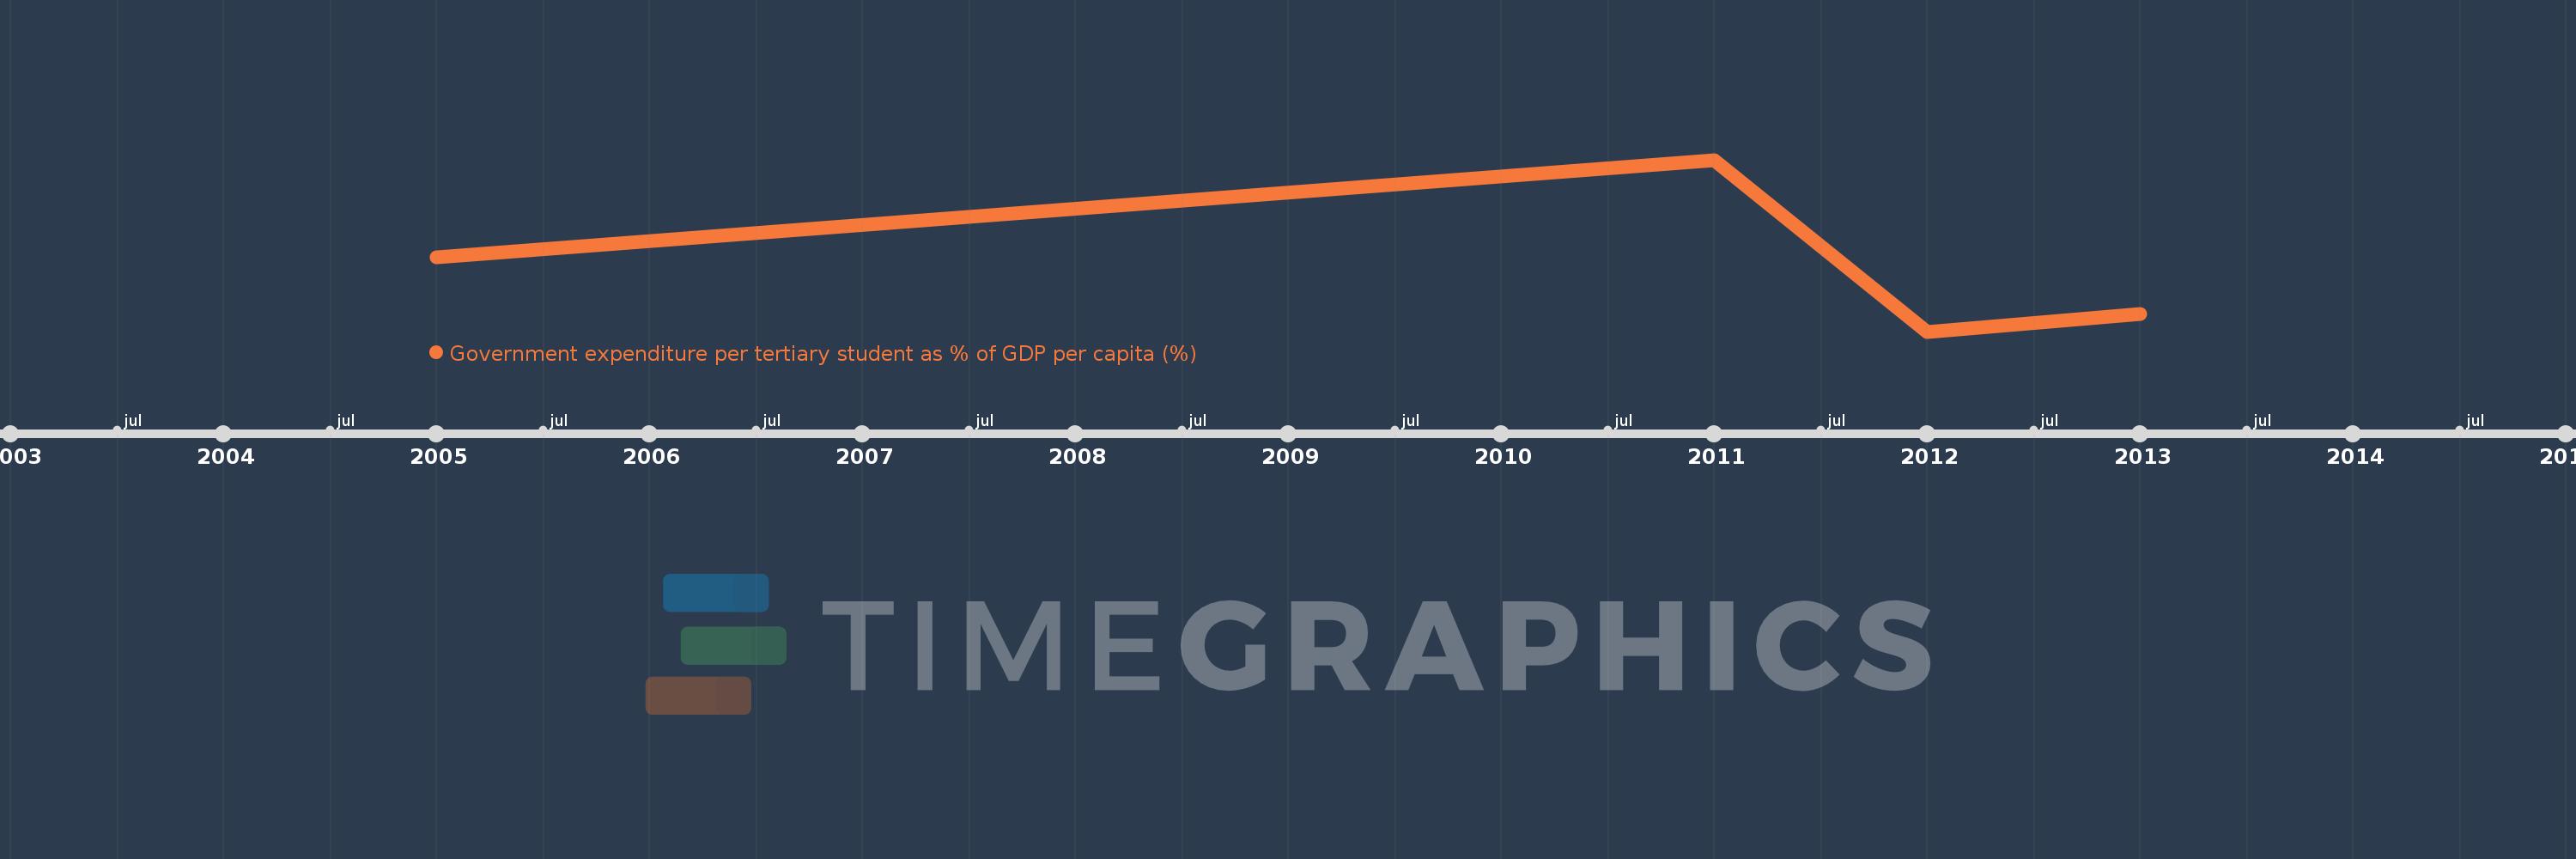
This timeline shows a graph from 2005 to 2013 of Gambia, The. No data until 2004. Number of actual observations by date: 4.
Source name:
World Development Indicators
Source organization:
UNESCO Institute for Statistics
Categories, topics:
Education
Last updated:
apr 23, 2017
Indicators value changes by year
Minimum:
97.133
jan 1, 2012
At the date of observation
Value
Absolute change
Change from the previous value
jan 1, 2005
145.906
+145.906
0.0%
jan 1, 2011
209.8
+63.895
43.79%
jan 1, 2012
97.133
-112.668
-53.7%
jan 1, 2013
108.78
+11.648
11.99%
Ranking of countries by current statistics by years