Download This statistics in other country:
Timeline:
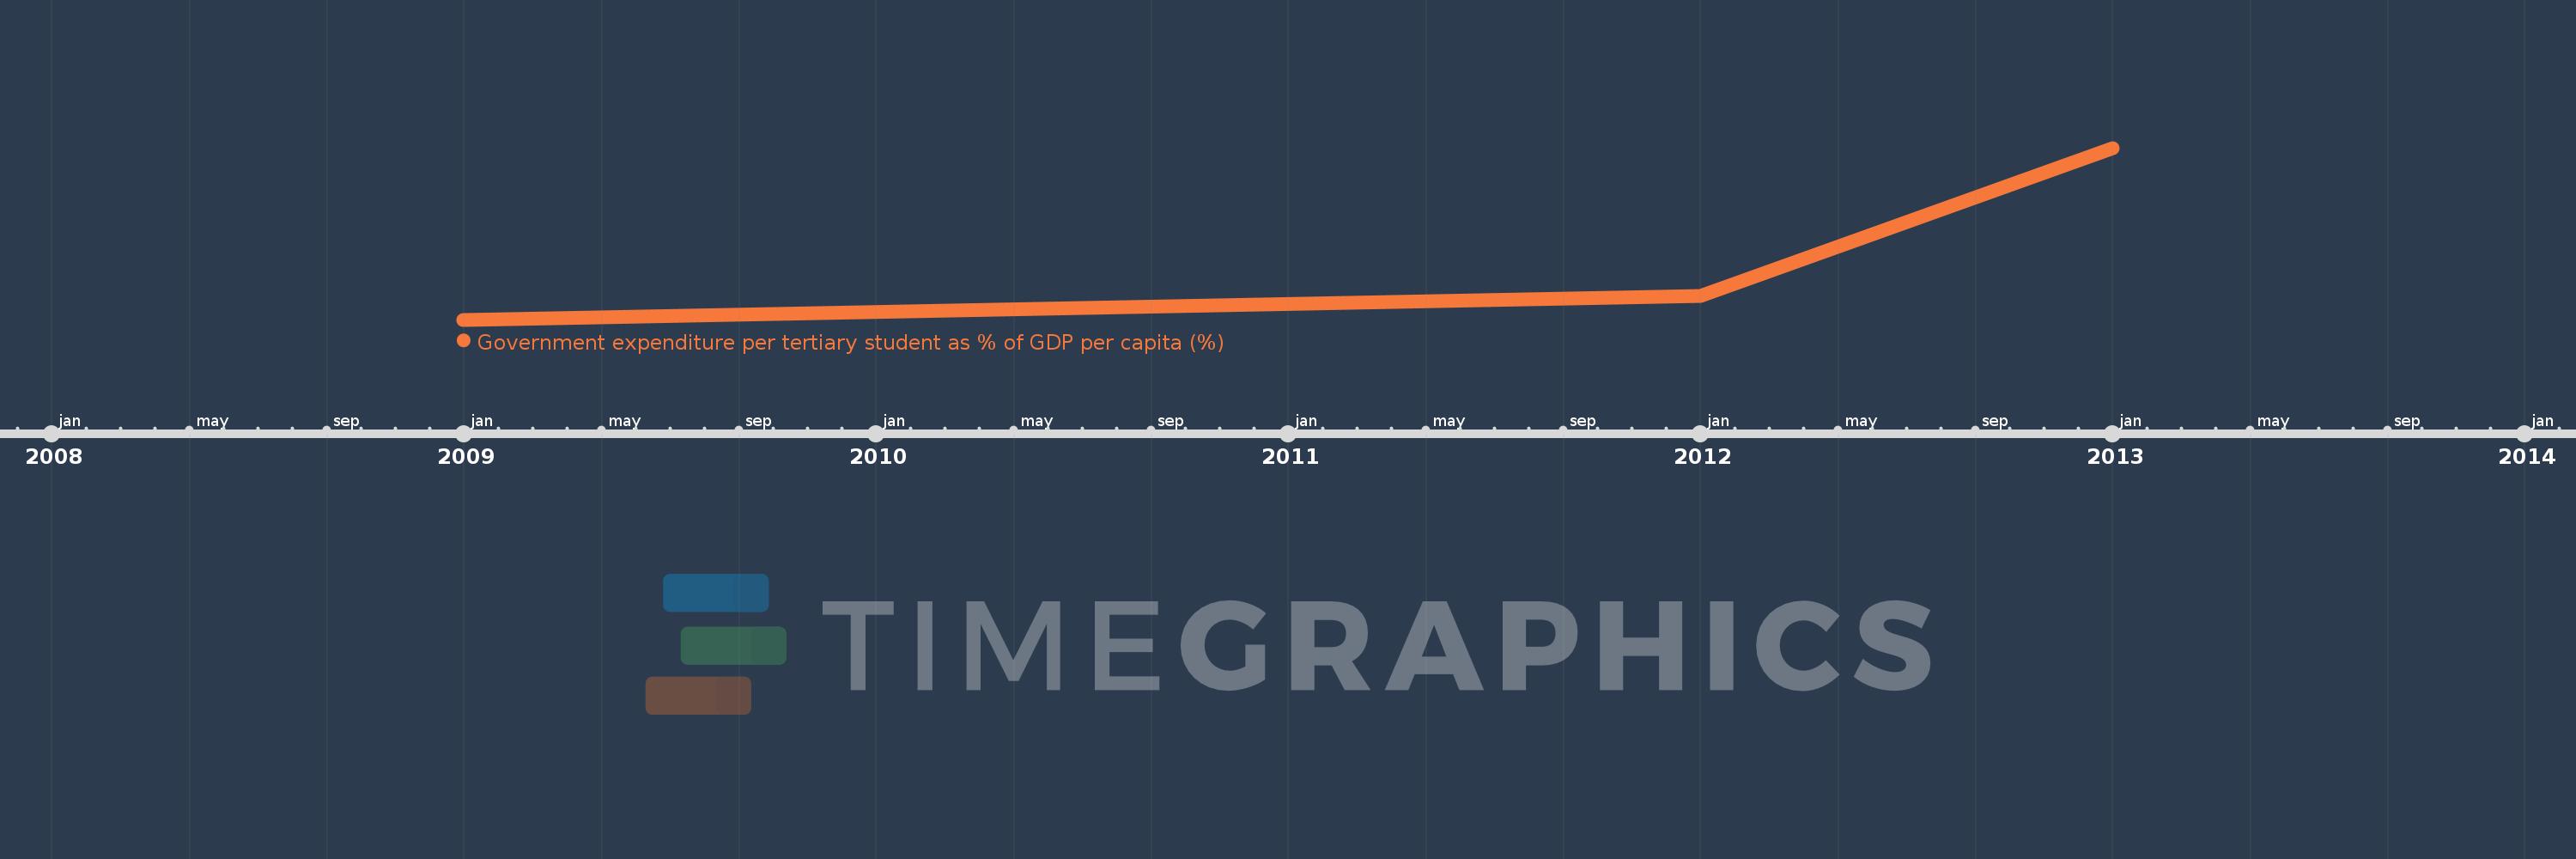
This timeline shows a graph from 2009 to 2013 of Georgia. No data until 2008. Number of actual observations by date: 3.
Source name:
World Development Indicators
Source organization:
UNESCO Institute for Statistics
Categories, topics:
Education
Last updated:
apr 23, 2017
Indicators value changes by year
Minimum:
11.404
jan 1, 2009
Maximum:
17.182
jan 1, 2013
At the date of observation
Value
Absolute change
Change from the previous value
jan 1, 2009
11.404
+11.404
0.0%
jan 1, 2012
12.203
+0.799
7.0%
jan 1, 2013
17.182
+4.979
40.8%
Ranking of countries by current statistics by years