Download This statistics in other country:
Timeline:
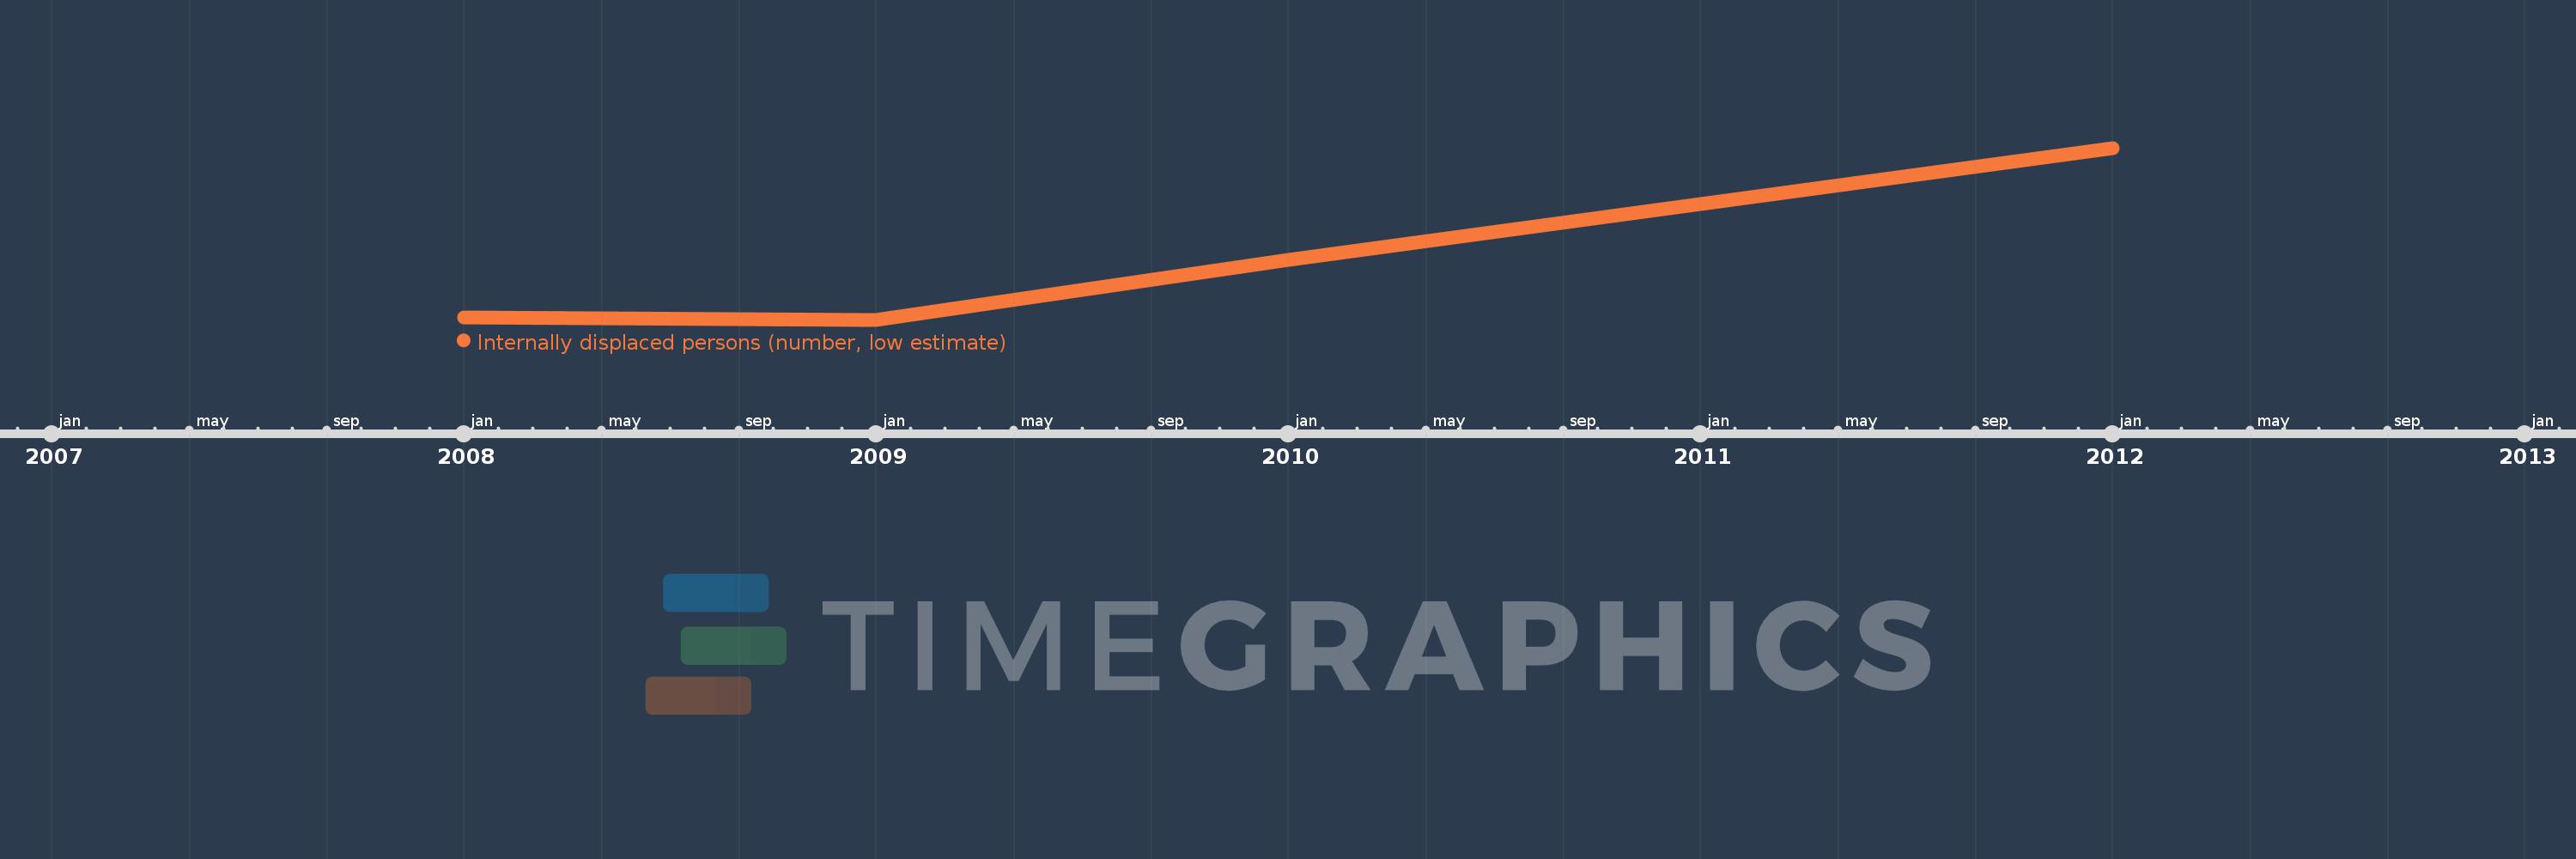
This timeline shows a graph from 2008 to 2012 of Yemen, Rep.. No data until 2007. Number of actual observations by date: 4.
Source name:
World Development Indicators
Source organization:
Internal Displacement Monitoring Centre.
Categories, topics:
Public Sector
Last updated:
apr 23, 2017
Indicators value changes by year
Maximum:
463.5K
jan 1, 2012
At the date of observation
Value
Absolute change
Change from the previous value
jan 1, 2008
25.0K
+25.0K
0.0%
jan 1, 2009
20.0K
-5.0K
-20.0%
jan 1, 2010
175.0K
+155.0K
775.0%
jan 1, 2012
463.5K
+288.5K
164.86%
Ranking of countries by current statistics by years