Download This statistics in other country:
Timeline:
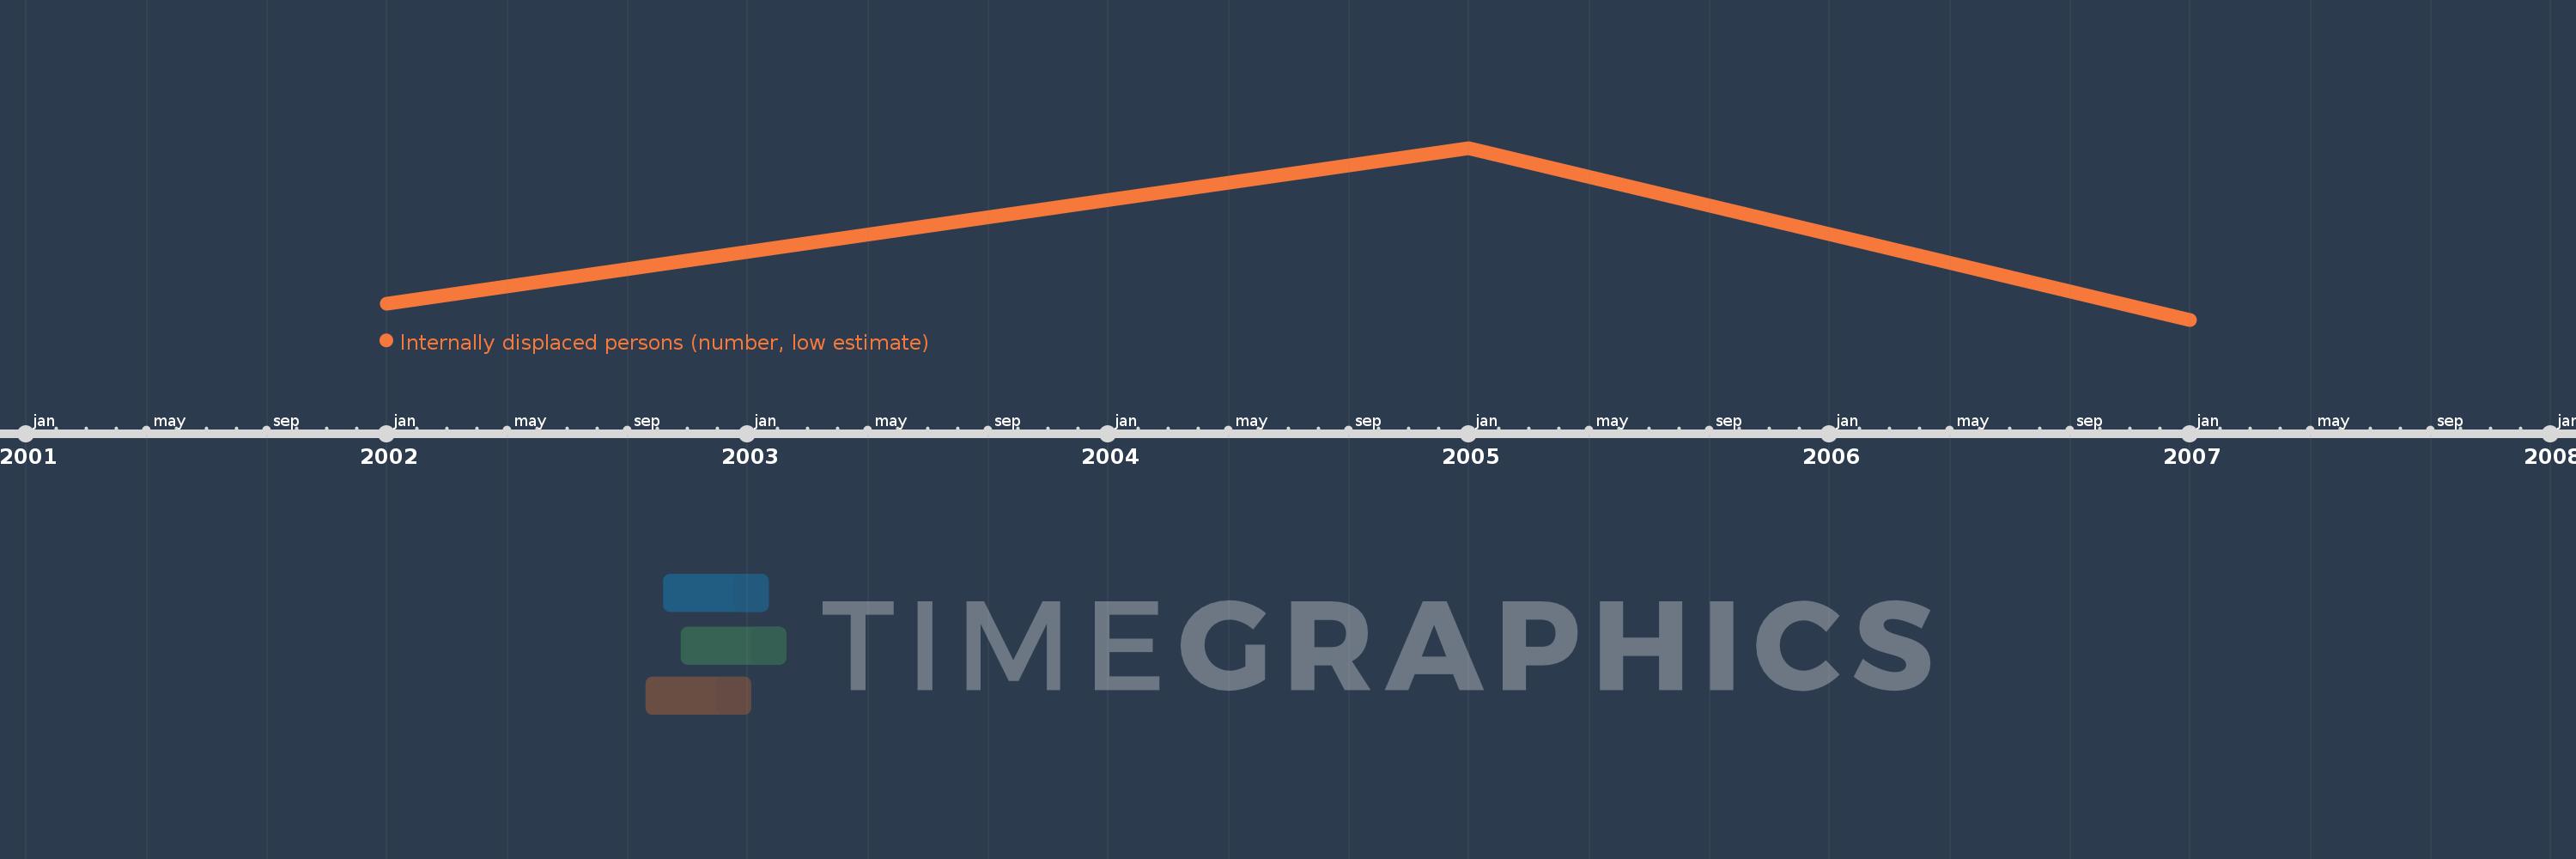
This timeline shows a graph from 2002 to 2007 of Liberia. No data until 2001. Number of actual observations by date: 3.
Source name:
World Development Indicators
Source organization:
Internal Displacement Monitoring Centre.
Categories, topics:
Public Sector
Last updated:
apr 23, 2017
Indicators value changes by year
Maximum:
310.0K
jan 1, 2005
At the date of observation
Value
Absolute change
Change from the previous value
jan 1, 2002
41.0K
+41.0K
0.0%
jan 1, 2005
310.0K
+269.0K
656.1%
jan 1, 2007
13.0K
-297.0K
-95.81%
Ranking of countries by current statistics by years