Download This statistics in other country:
Timeline:
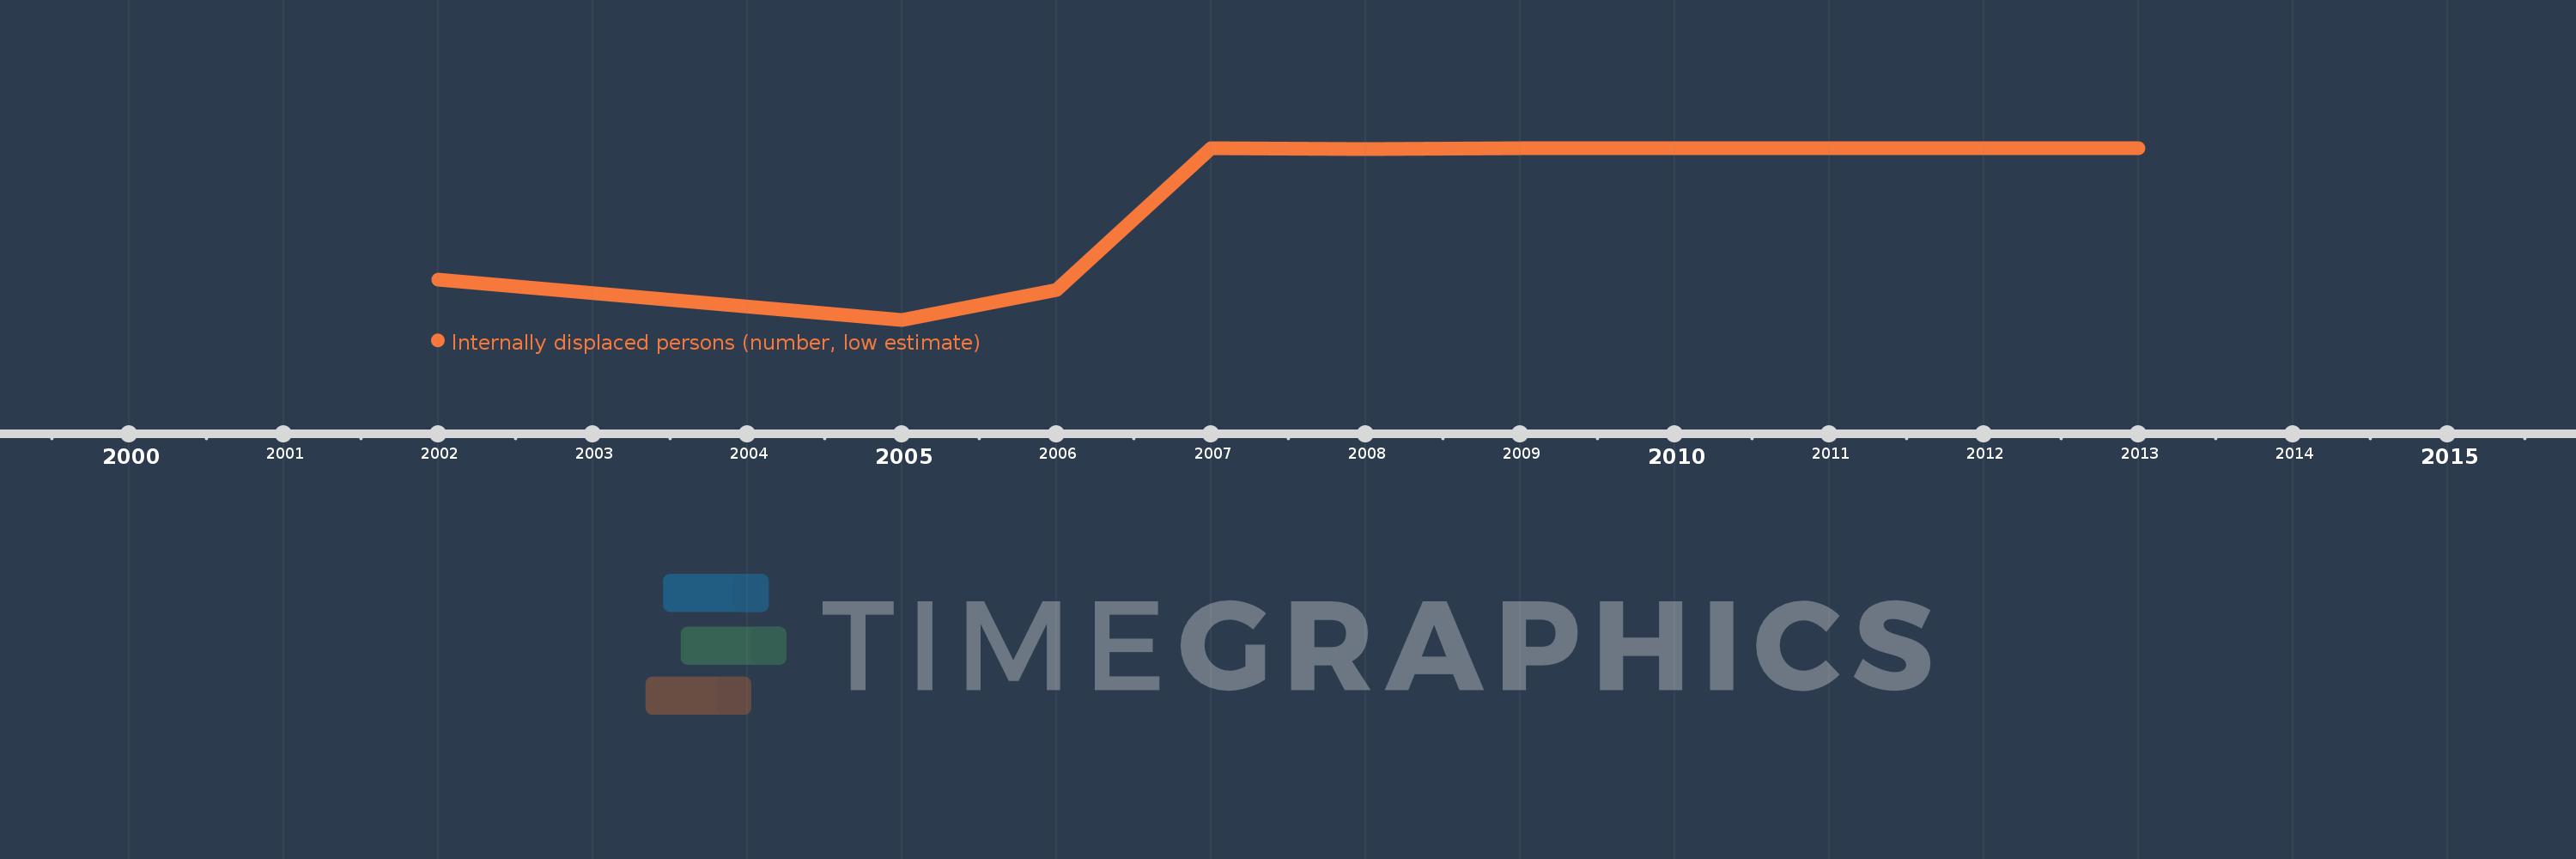
This timeline shows a graph from 2002 to 2013 of Turkey. No data until 2001. Number of actual observations by date: 10.
Source name:
World Development Indicators
Source organization:
Internal Displacement Monitoring Centre.
Categories, topics:
Public Sector
Last updated:
apr 23, 2017
Indicators value changes by year
Minimum:
230.0K
jan 1, 2005
Maximum:
954.0K
jan 1, 2007
At the date of observation
Value
Absolute change
Change from the previous value
jan 1, 2002
400.0K
+400.0K
0.0%
jan 1, 2005
230.0K
-170.0K
-42.5%
jan 1, 2006
355.807K
+125.807K
54.7%
jan 1, 2007
954.0K
+598.193K
168.12%
jan 1, 2008
950.0K
-4.0K
-0.42%
jan 1, 2009
954.0K
+4.0K
0.42%
jan 1, 2010
954.0K
0.0
0.0%
jan 1, 2011
954.0K
0.0
0.0%
jan 1, 2012
954.0K
0.0
0.0%
jan 1, 2013
954.0K
0.0
0.0%
Ranking of countries by current statistics by years