Download This statistics in other country:
Timeline:
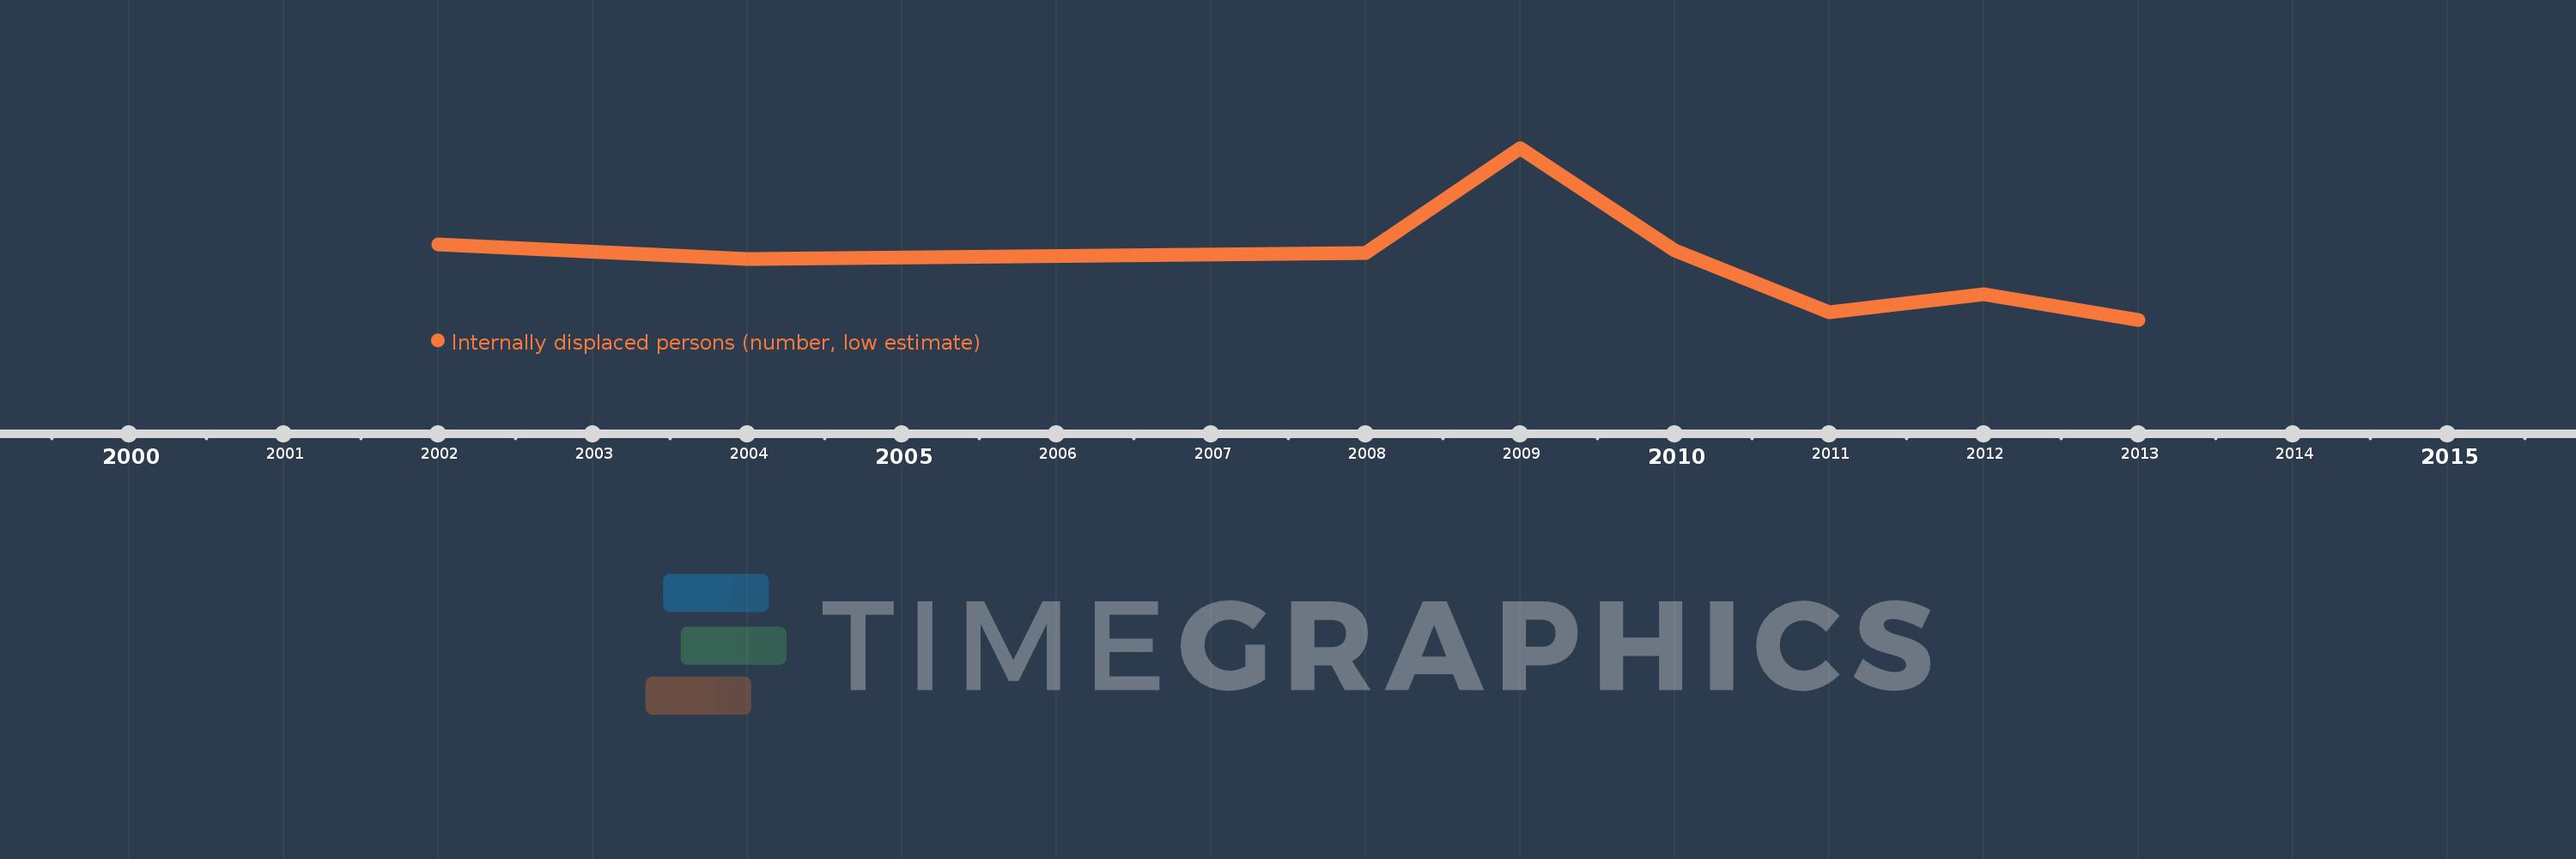
This timeline shows a graph from 2002 to 2013 of Philippines. No data until 2001. Number of actual observations by date: 8.
Source name:
World Development Indicators
Source organization:
Internal Displacement Monitoring Centre.
Categories, topics:
Public Sector
Last updated:
apr 23, 2017
Indicators value changes by year
Maximum:
308.0K
jan 1, 2009
At the date of observation
Value
Absolute change
Change from the previous value
jan 1, 2002
135.0K
+135.0K
0.0%
jan 1, 2004
110.0K
-25.0K
-18.52%
jan 1, 2008
120.0K
+10.0K
9.09%
jan 1, 2009
308.0K
+188.0K
156.67%
jan 1, 2010
125.0K
-183.0K
-59.42%
jan 1, 2011
15.0K
-110.0K
-88.0%
jan 1, 2012
46.0K
+31.0K
206.67%
jan 1, 2013
1.2K
-44.8K
-97.39%
Ranking of countries by current statistics by years