Download This statistics in other country:
Timeline:
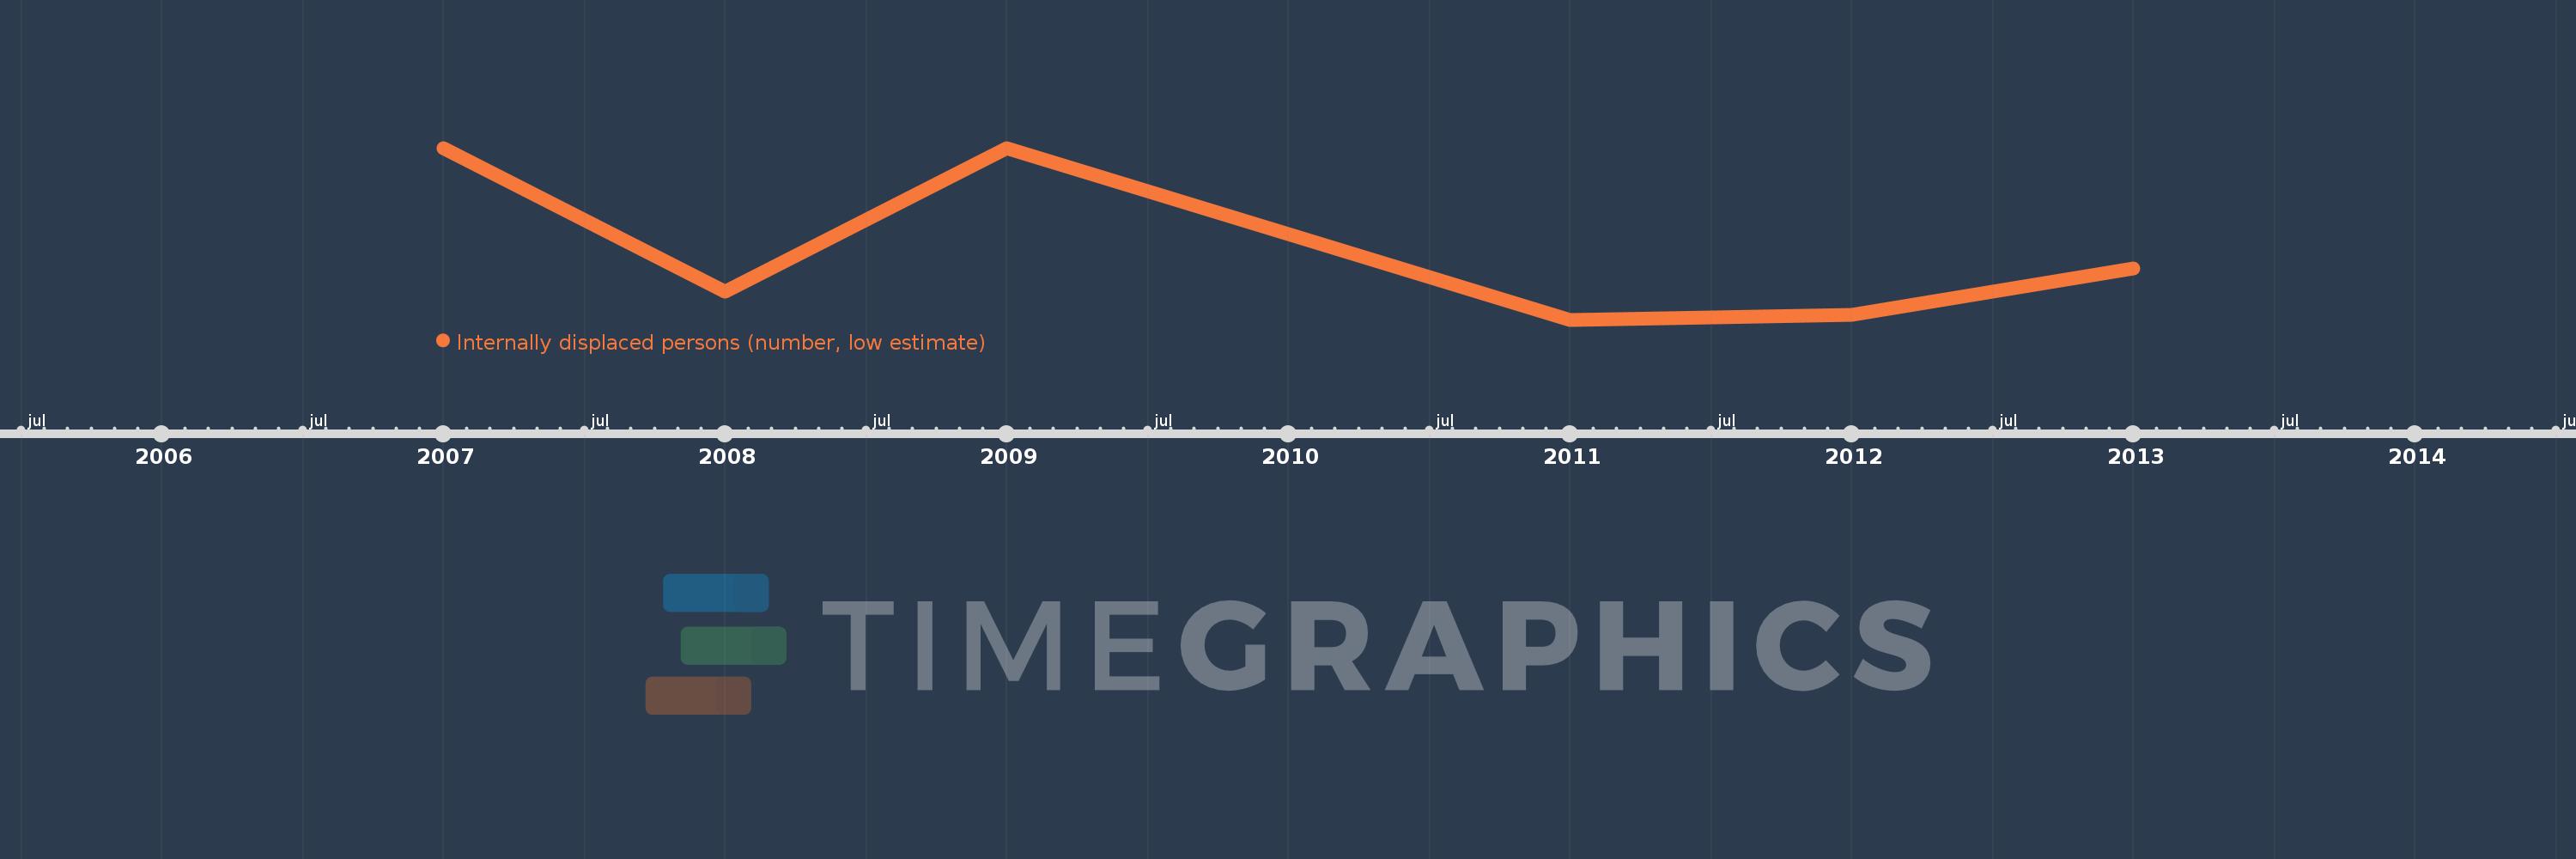
This timeline shows a graph from 2007 to 2013 of Russian Federation. No data until 2006. Number of actual observations by date: 6.
Source name:
World Development Indicators
Source organization:
Internal Displacement Monitoring Centre.
Categories, topics:
Public Sector
Last updated:
apr 23, 2017
Indicators value changes by year
At the date of observation
Value
Absolute change
Change from the previous value
jan 1, 2007
82.0K
+82.0K
0.0%
jan 1, 2008
19.0K
-63.0K
-76.83%
jan 1, 2009
82.0K
+63.0K
331.58%
jan 1, 2011
6.5K
-75.5K
-92.07%
jan 1, 2012
8.5K
+2.0K
30.77%
jan 1, 2013
29.0K
+20.5K
241.18%
Ranking of countries by current statistics by years