Download This statistics in other country:
Timeline:
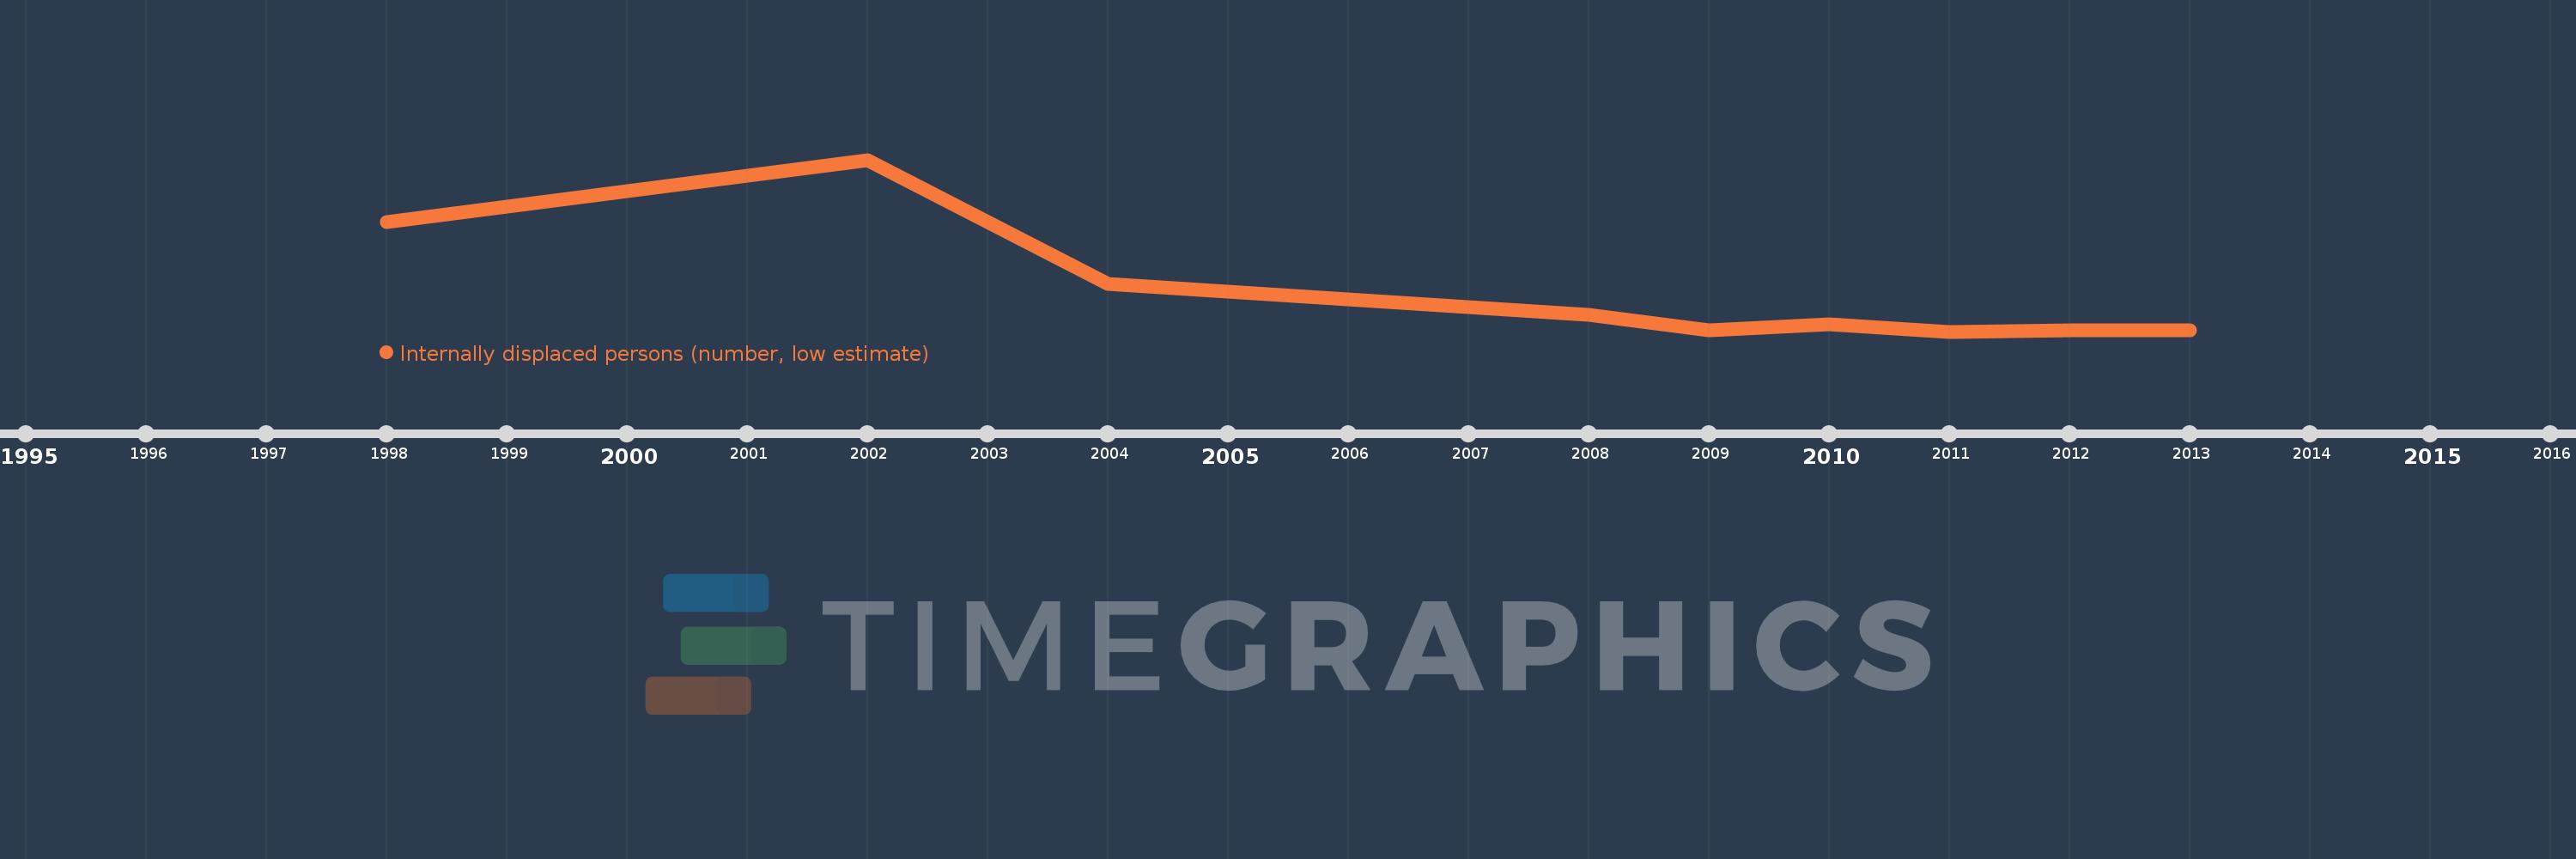
This timeline shows a graph from 1998 to 2013 of Myanmar. No data until 1997. Number of actual observations by date: 9.
Source name:
World Development Indicators
Source organization:
Internal Displacement Monitoring Centre.
Categories, topics:
Public Sector
Last updated:
apr 23, 2017
Indicators value changes by year
Minimum:
446.0K
jan 1, 2011
Maximum:
1000.0K
jan 1, 2002
At the date of observation
Value
Absolute change
Change from the previous value
jan 1, 1998
800.0K
+800.0K
0.0%
jan 1, 2002
1000.0K
+200.0K
25.0%
jan 1, 2004
600.0K
-400.0K
-40.0%
jan 1, 2008
500.0K
-100.0K
-16.67%
jan 1, 2009
451.0K
-49.0K
-9.8%
jan 1, 2010
470.0K
+19.0K
4.21%
jan 1, 2011
446.0K
-24.0K
-5.11%
jan 1, 2012
450.0K
+4.0K
0.9%
jan 1, 2013
450.0K
0.0
0.0%
Ranking of countries by current statistics by years