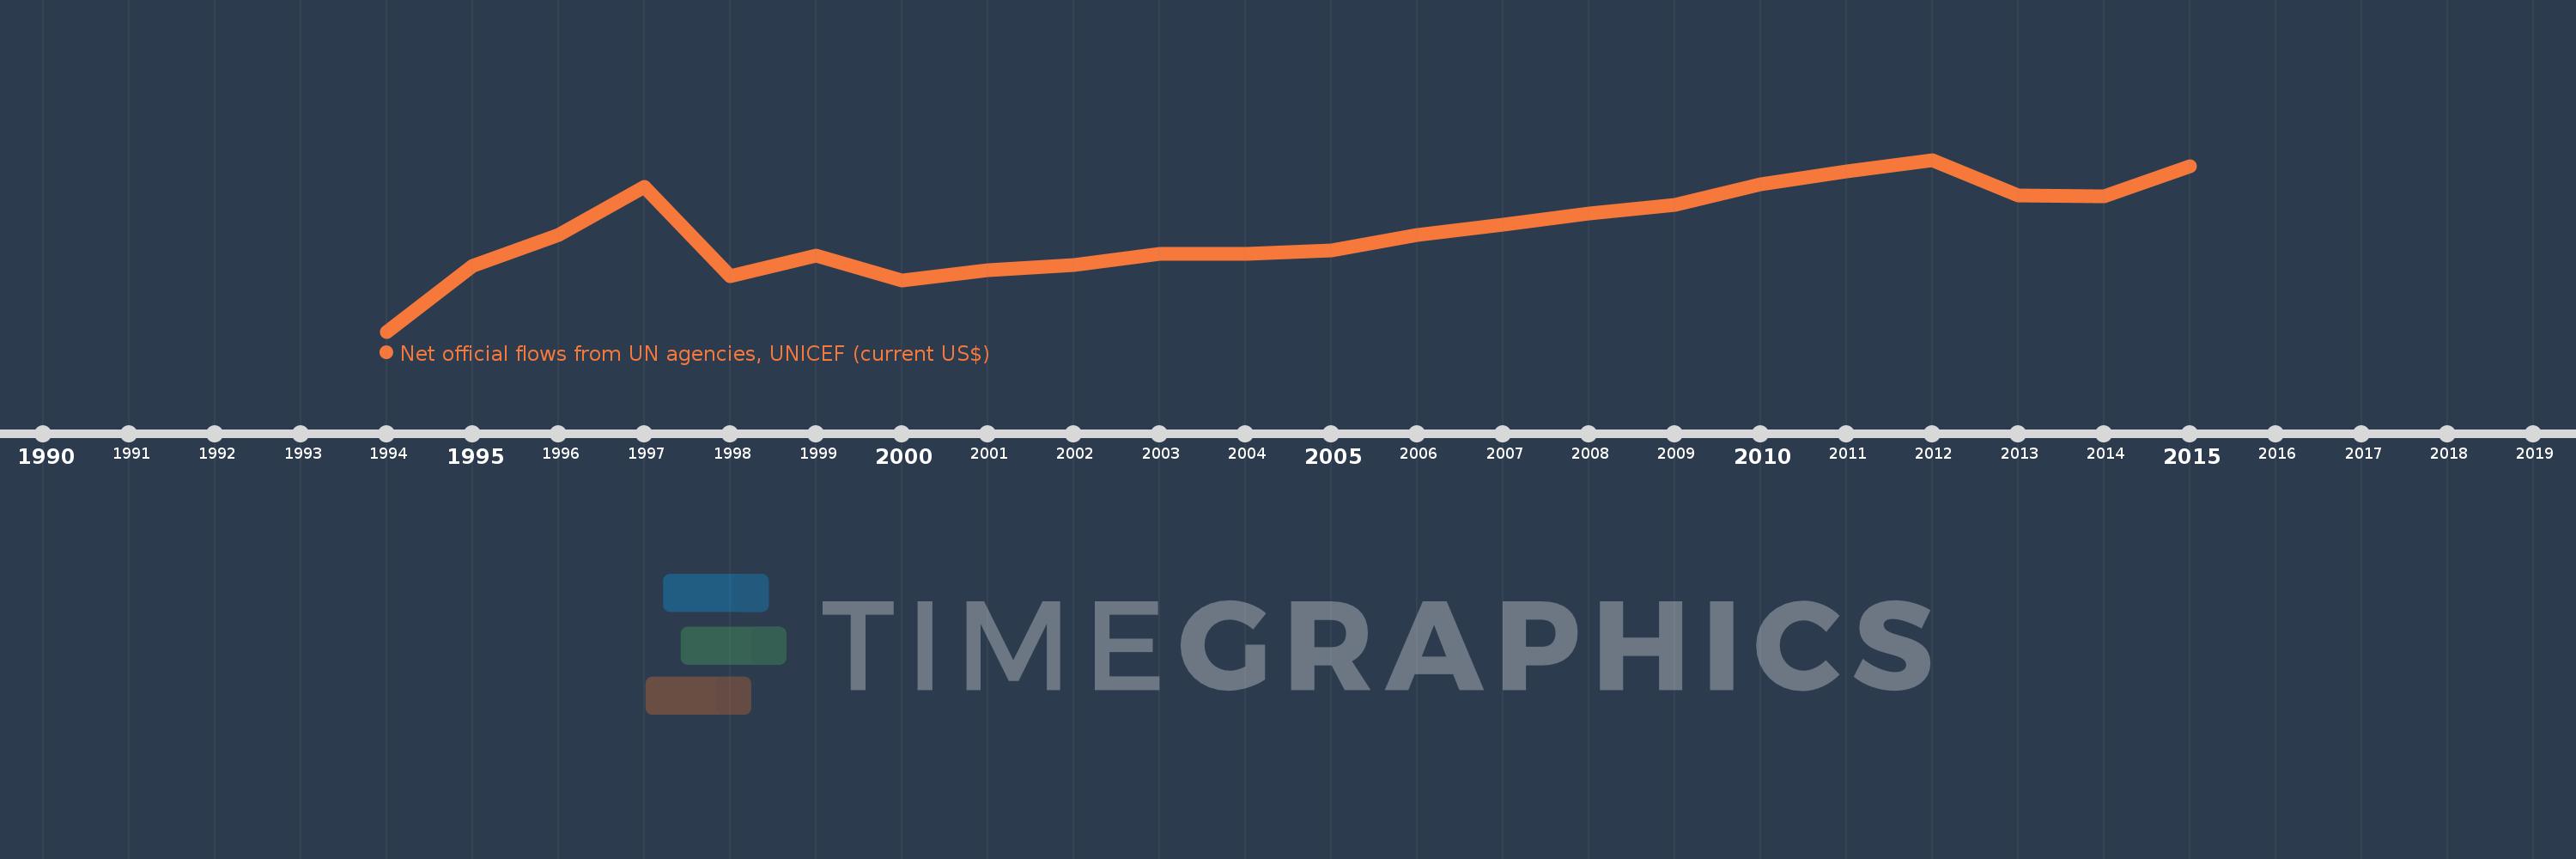
This timeline shows a graph from 1994 to 2015 of Uzbekistan. No data until 1993. Number of actual observations by date: 22.
Source name:
World Development Indicators
Source organization:
Development Assistance Committee of the Organisation for Economic Co-operation and Development, Geographical Distribution of Financial Flows to Developing Countries, Development Co-operation Report, and International Development Statistics database. Data are available online at: www.oecd.org/dac/stats/idsonline.
Categories, topics:
Aid Effectiveness
Last updated:
apr 23, 2017
Indicators value changes by year
Meaning:
2.377 mln
Minimum:
40.0K
jan 1, 1994
Maximum:
4.02 mln
jan 1, 2012
At the date of observation
Value
Absolute change
Change from the previous value
jan 1, 1994
40.0K
+40.0K
0.0%
jan 1, 1995
1.56 mln
+1.52 mln
3.8K%
jan 1, 1996
2.27 mln
+710.0K
45.51%
jan 1, 1997
3.4 mln
+1.13 mln
49.78%
jan 1, 1998
1.32 mln
-2.08 mln
-61.18%
jan 1, 1999
1.8 mln
+480.0K
36.36%
jan 1, 2000
1.22 mln
-580.0K
-32.22%
jan 1, 2001
1.46 mln
+240.0K
19.67%
jan 1, 2002
1.59 mln
+130.0K
8.9%
jan 1, 2003
1.85 mln
+260.0K
16.35%
jan 1, 2004
1.84 mln
-10.0K
-0.54%
jan 1, 2005
1.93 mln
+90.0K
4.89%
jan 1, 2006
2.27 mln
+340.0K
17.62%
jan 1, 2007
2.51 mln
+240.0K
10.57%
jan 1, 2008
2.77 mln
+260.0K
10.36%
jan 1, 2009
2.97 mln
+200.0K
7.22%
jan 1, 2010
3.46 mln
+490.0K
16.5%
jan 1, 2011
3.76 mln
+300.0K
8.67%
jan 1, 2012
4.02 mln
+260.0K
6.91%
jan 1, 2013
3.2 mln
-820.0K
-20.4%
jan 1, 2014
3.18 mln
-20.0K
-0.62%
jan 1, 2015
3.88 mln
+700.0K
22.01%
Ranking of countries by current statistics by years