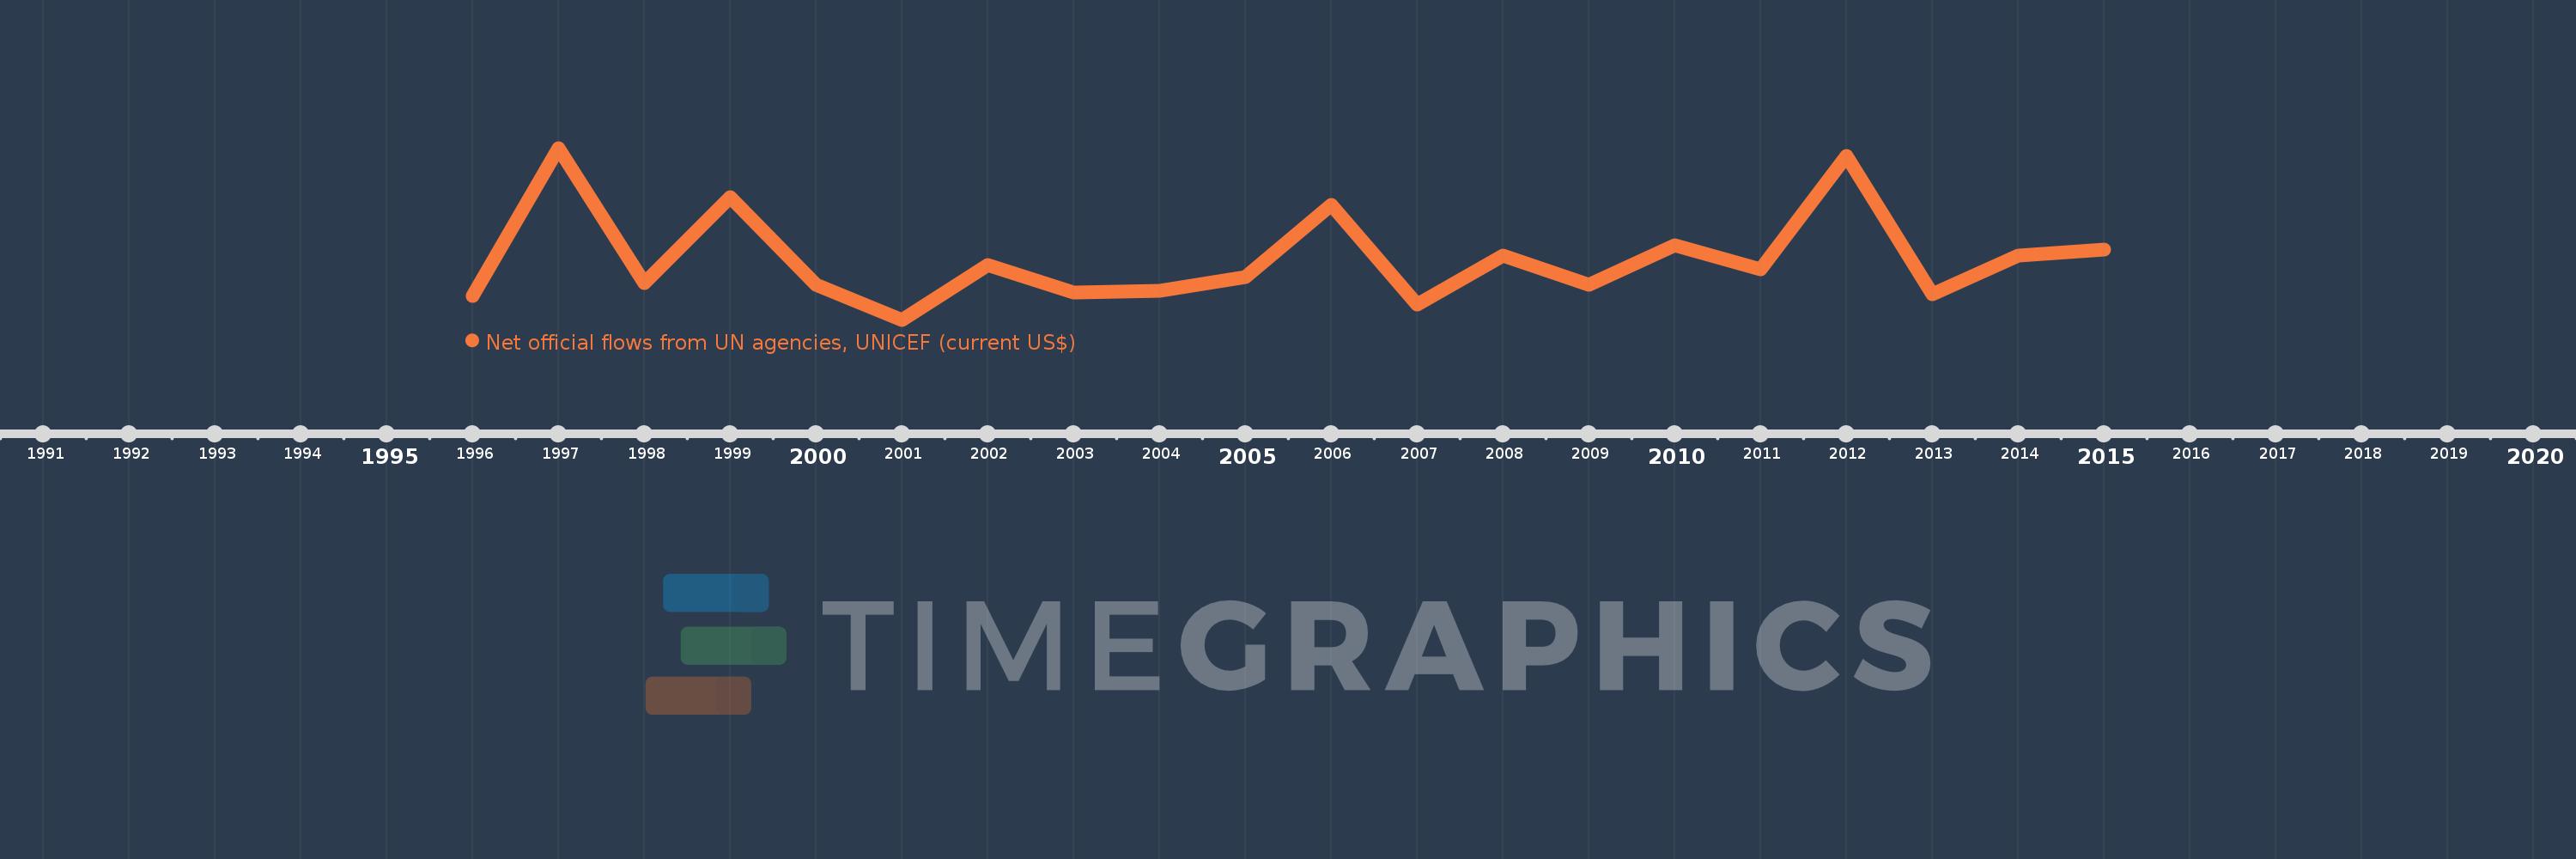
This timeline shows a graph from 1996 to 2015 of Macedonia, FYR. No data until 1995. Number of actual observations by date: 20.
Source name:
World Development Indicators
Source organization:
Development Assistance Committee of the Organisation for Economic Co-operation and Development, Geographical Distribution of Financial Flows to Developing Countries, Development Co-operation Report, and International Development Statistics database. Data are available online at: www.oecd.org/dac/stats/idsonline.
Categories, topics:
Aid Effectiveness
Last updated:
apr 23, 2017
Indicators value changes by year
Meaning:
793.5K
Minimum:
480.0K
jan 1, 2001
Maximum:
1.36 mln
jan 1, 1997
At the date of observation
Value
Absolute change
Change from the previous value
jan 1, 1996
600.0K
+600.0K
0.0%
jan 1, 1997
1.36 mln
+760.0K
126.67%
jan 1, 1998
670.0K
-690.0K
-50.74%
jan 1, 1999
1.11 mln
+440.0K
65.67%
jan 1, 2000
660.0K
-450.0K
-40.54%
jan 1, 2001
480.0K
-180.0K
-27.27%
jan 1, 2002
760.0K
+280.0K
58.33%
jan 1, 2003
620.0K
-140.0K
-18.42%
jan 1, 2004
630.0K
+10.0K
1.61%
jan 1, 2005
700.0K
+70.0K
11.11%
jan 1, 2006
1.07 mln
+370.0K
52.86%
jan 1, 2007
560.0K
-510.0K
-47.66%
jan 1, 2008
810.0K
+250.0K
44.64%
jan 1, 2009
660.0K
-150.0K
-18.52%
jan 1, 2010
860.0K
+200.0K
30.3%
jan 1, 2011
740.0K
-120.0K
-13.95%
jan 1, 2012
1.32 mln
+580.0K
78.38%
jan 1, 2013
610.0K
-710.0K
-53.79%
jan 1, 2014
810.0K
+200.0K
32.79%
jan 1, 2015
840.0K
+30.0K
3.7%
Ranking of countries by current statistics by years