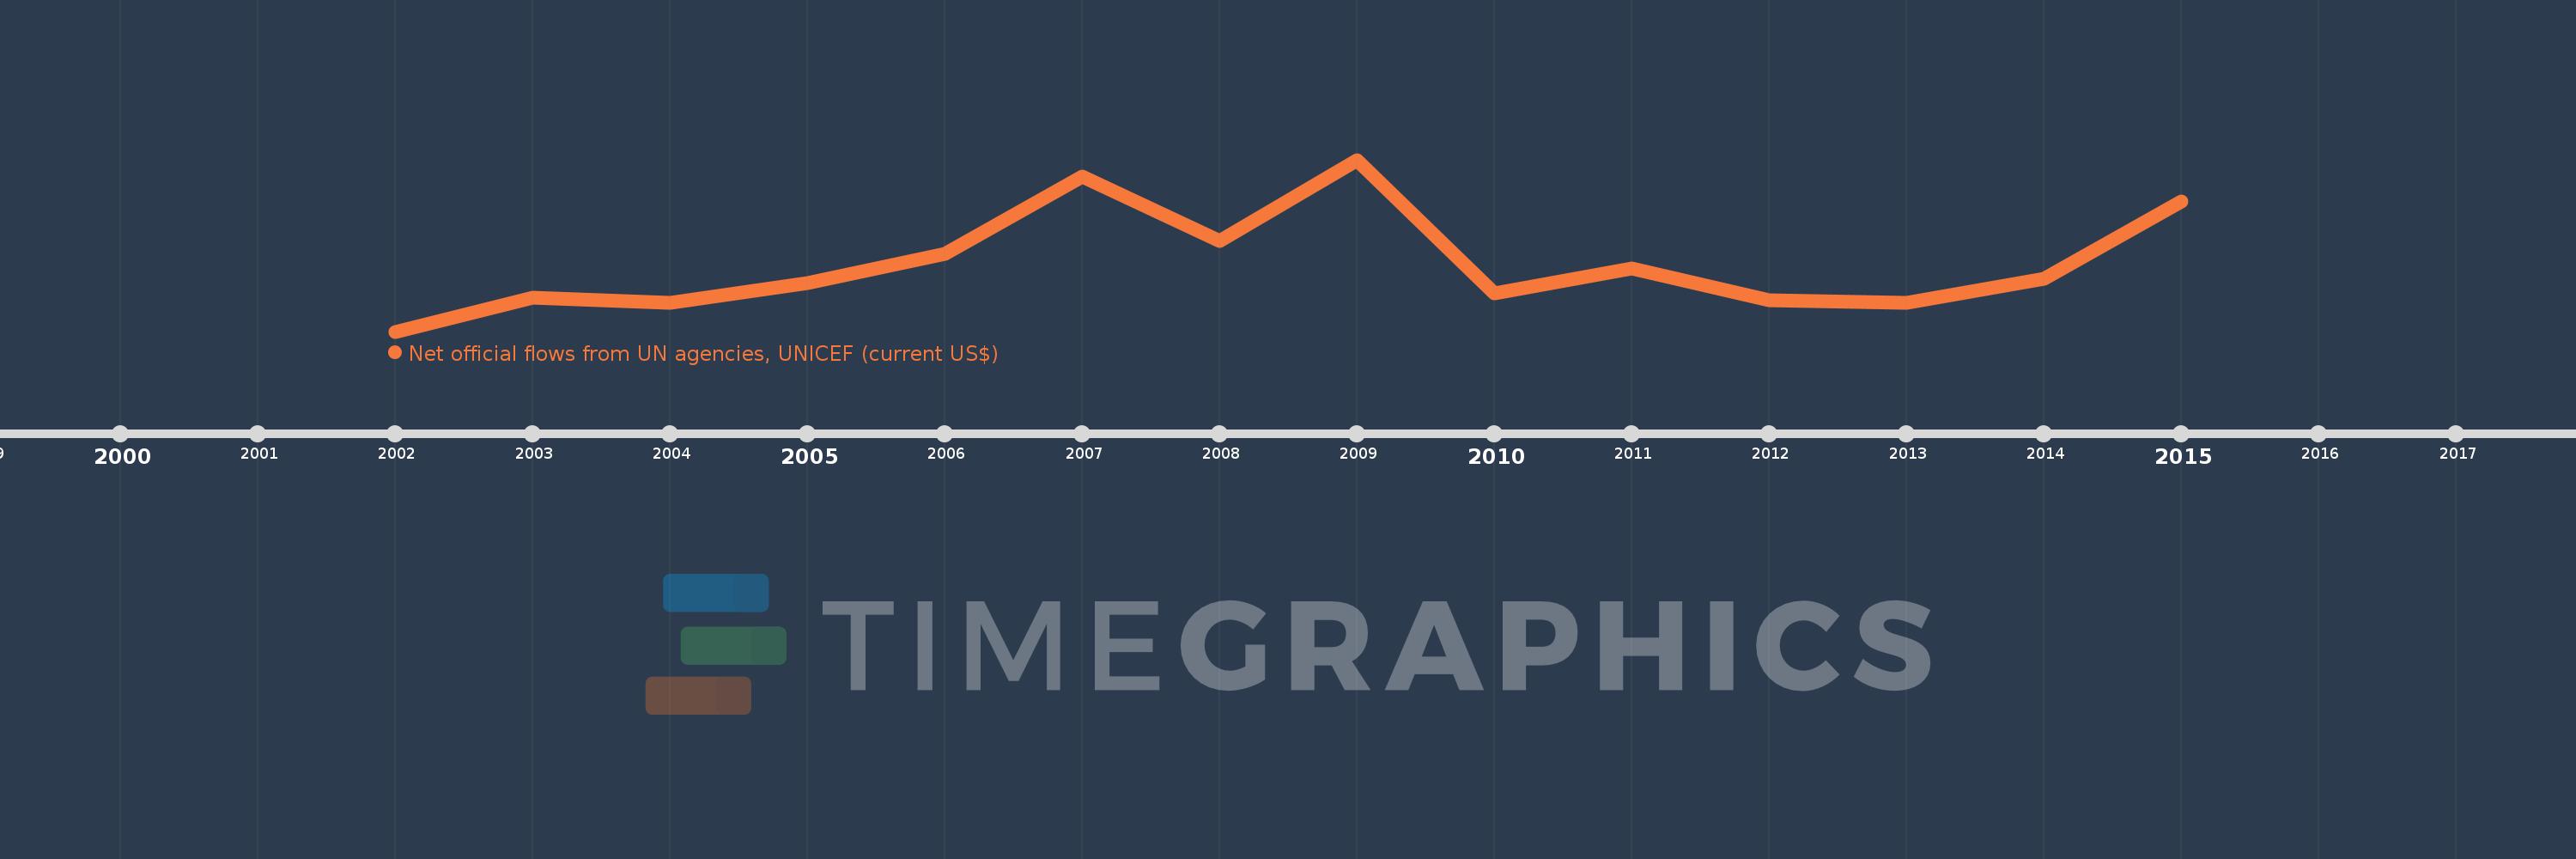
This timeline shows a graph from 2002 to 2015 of Serbia. No data until 2001. Number of actual observations by date: 14.
Source name:
World Development Indicators
Source organization:
Development Assistance Committee of the Organisation for Economic Co-operation and Development, Geographical Distribution of Financial Flows to Developing Countries, Development Co-operation Report, and International Development Statistics database. Data are available online at: www.oecd.org/dac/stats/idsonline.
Categories, topics:
Aid Effectiveness
Last updated:
apr 23, 2017
Indicators value changes by year
Meaning:
966.429K
Minimum:
120.0K
jan 1, 2002
Maximum:
2.26 mln
jan 1, 2009
At the date of observation
Value
Absolute change
Change from the previous value
jan 1, 2002
120.0K
+120.0K
0.0%
jan 1, 2003
540.0K
+420.0K
350.0%
jan 1, 2004
480.0K
-60.0K
-11.11%
jan 1, 2005
720.0K
+240.0K
50.0%
jan 1, 2006
1.09 mln
+370.0K
51.39%
jan 1, 2007
2.05 mln
+960.0K
88.07%
jan 1, 2008
1.25 mln
-800.0K
-39.02%
jan 1, 2009
2.26 mln
+1.01 mln
80.8%
jan 1, 2010
600.0K
-1.66 mln
-73.45%
jan 1, 2011
910.0K
+310.0K
51.67%
jan 1, 2012
510.0K
-400.0K
-43.96%
jan 1, 2013
480.0K
-30.0K
-5.88%
jan 1, 2014
780.0K
+300.0K
62.5%
jan 1, 2015
1.74 mln
+960.0K
123.08%
Ranking of countries by current statistics by years