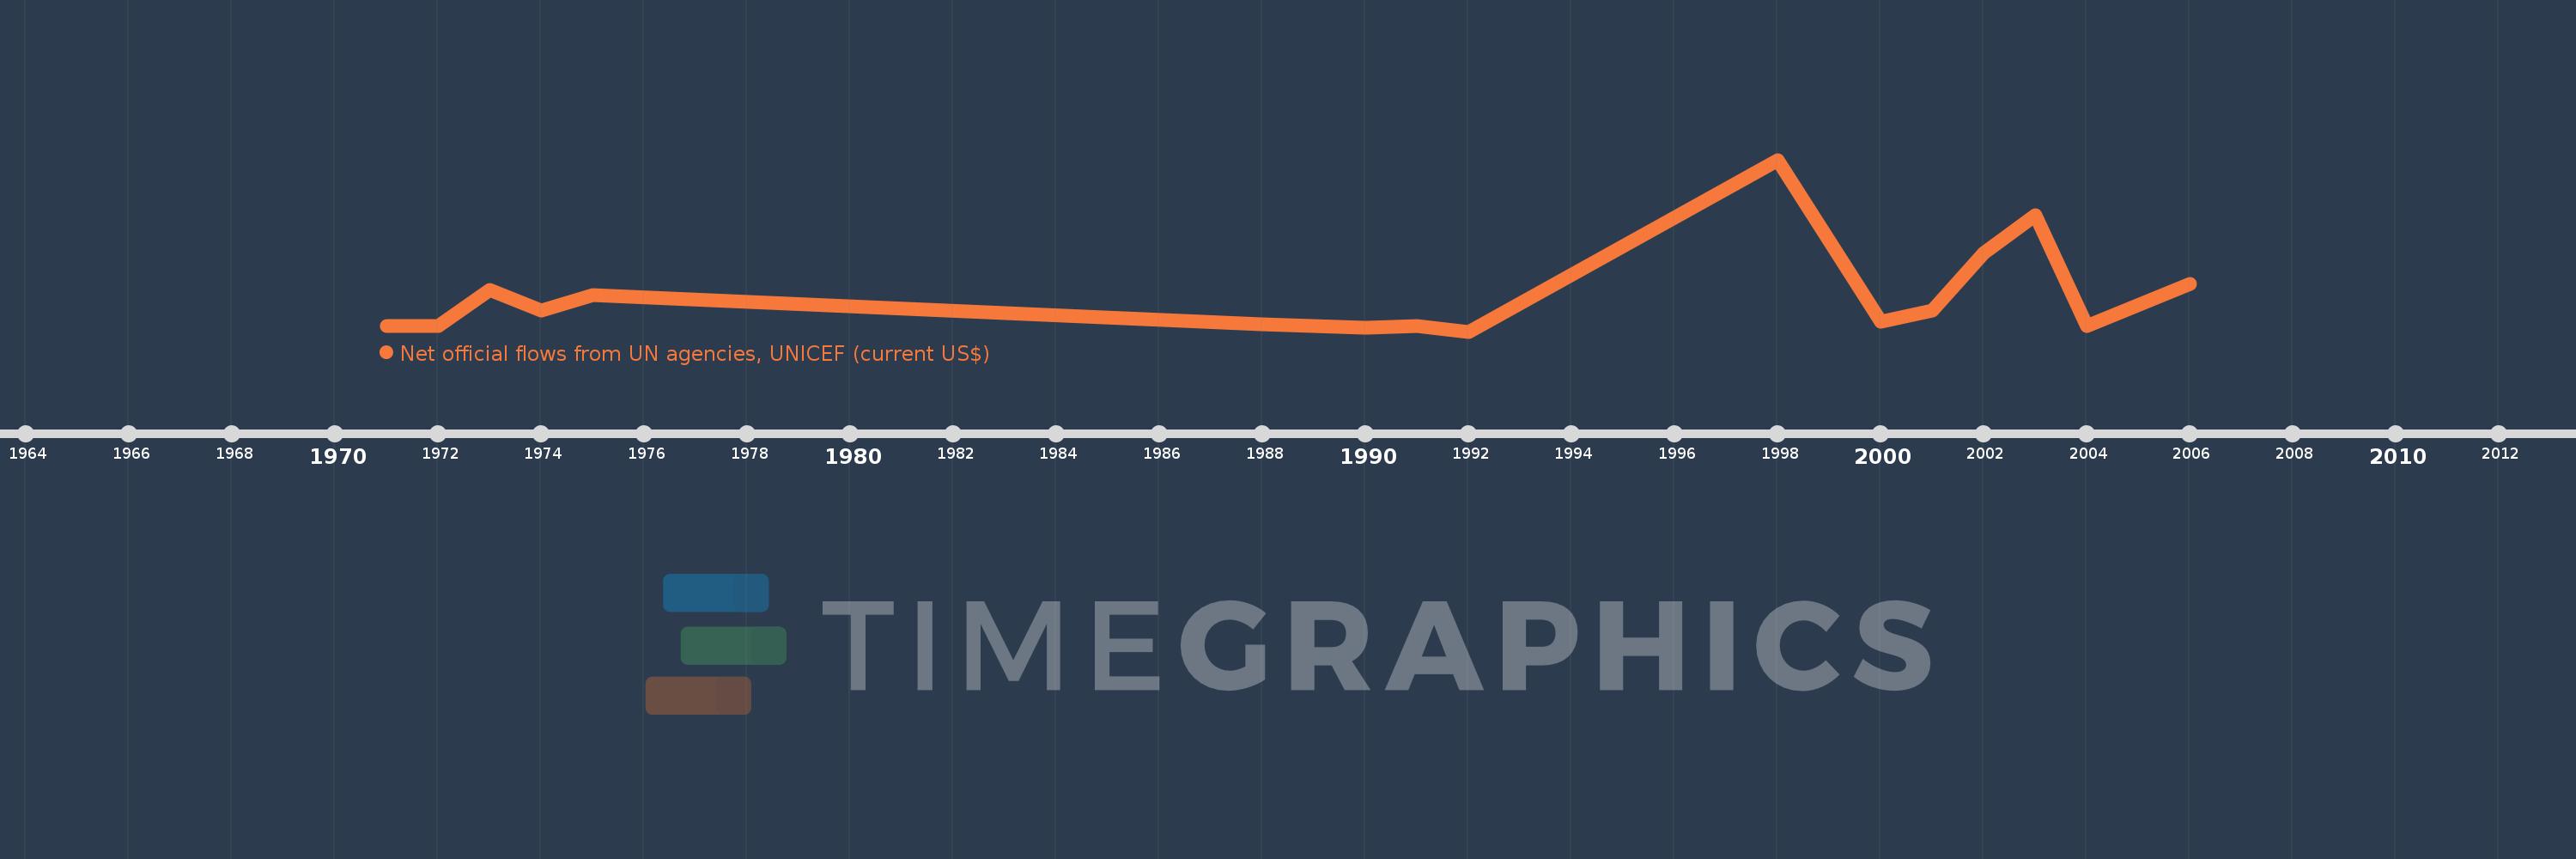
This timeline shows a graph from 1971 to 2006 of Saudi Arabia. No data until 1970. Number of actual observations by date: 16.
Source name:
World Development Indicators
Source organization:
Development Assistance Committee of the Organisation for Economic Co-operation and Development, Geographical Distribution of Financial Flows to Developing Countries, Development Co-operation Report, and International Development Statistics database. Data are available online at: www.oecd.org/dac/stats/idsonline.
Categories, topics:
Aid Effectiveness
Last updated:
apr 23, 2017
Indicators value changes by year
Meaning:
179.375K
Minimum:
-10.0K
jan 1, 1992
Maximum:
890.0K
jan 1, 1998
At the date of observation
Value
Absolute change
Change from the previous value
jan 1, 1971
20.0K
+20.0K
0.0%
jan 1, 1972
20.0K
0.0
0.0%
jan 1, 1973
210.0K
+190.0K
950.0%
jan 1, 1974
100.0K
-110.0K
-52.38%
jan 1, 1975
180.0K
+80.0K
80.0%
jan 1, 1988
30.0K
-150.0K
-83.33%
jan 1, 1990
10.0K
-20.0K
-66.67%
jan 1, 1991
20.0K
+10.0K
100.0%
jan 1, 1992
-10.0K
-30.0K
-150.0%
jan 1, 1998
890.0K
+900.0K
-9.0K%
jan 1, 2000
40.0K
-850.0K
-95.51%
jan 1, 2001
100.0K
+60.0K
150.0%
jan 1, 2002
400.0K
+300.0K
300.0%
jan 1, 2003
600.0K
+200.0K
50.0%
jan 1, 2004
20.0K
-580.0K
-96.67%
jan 1, 2006
240.0K
+220.0K
1.1K%
Ranking of countries by current statistics by years