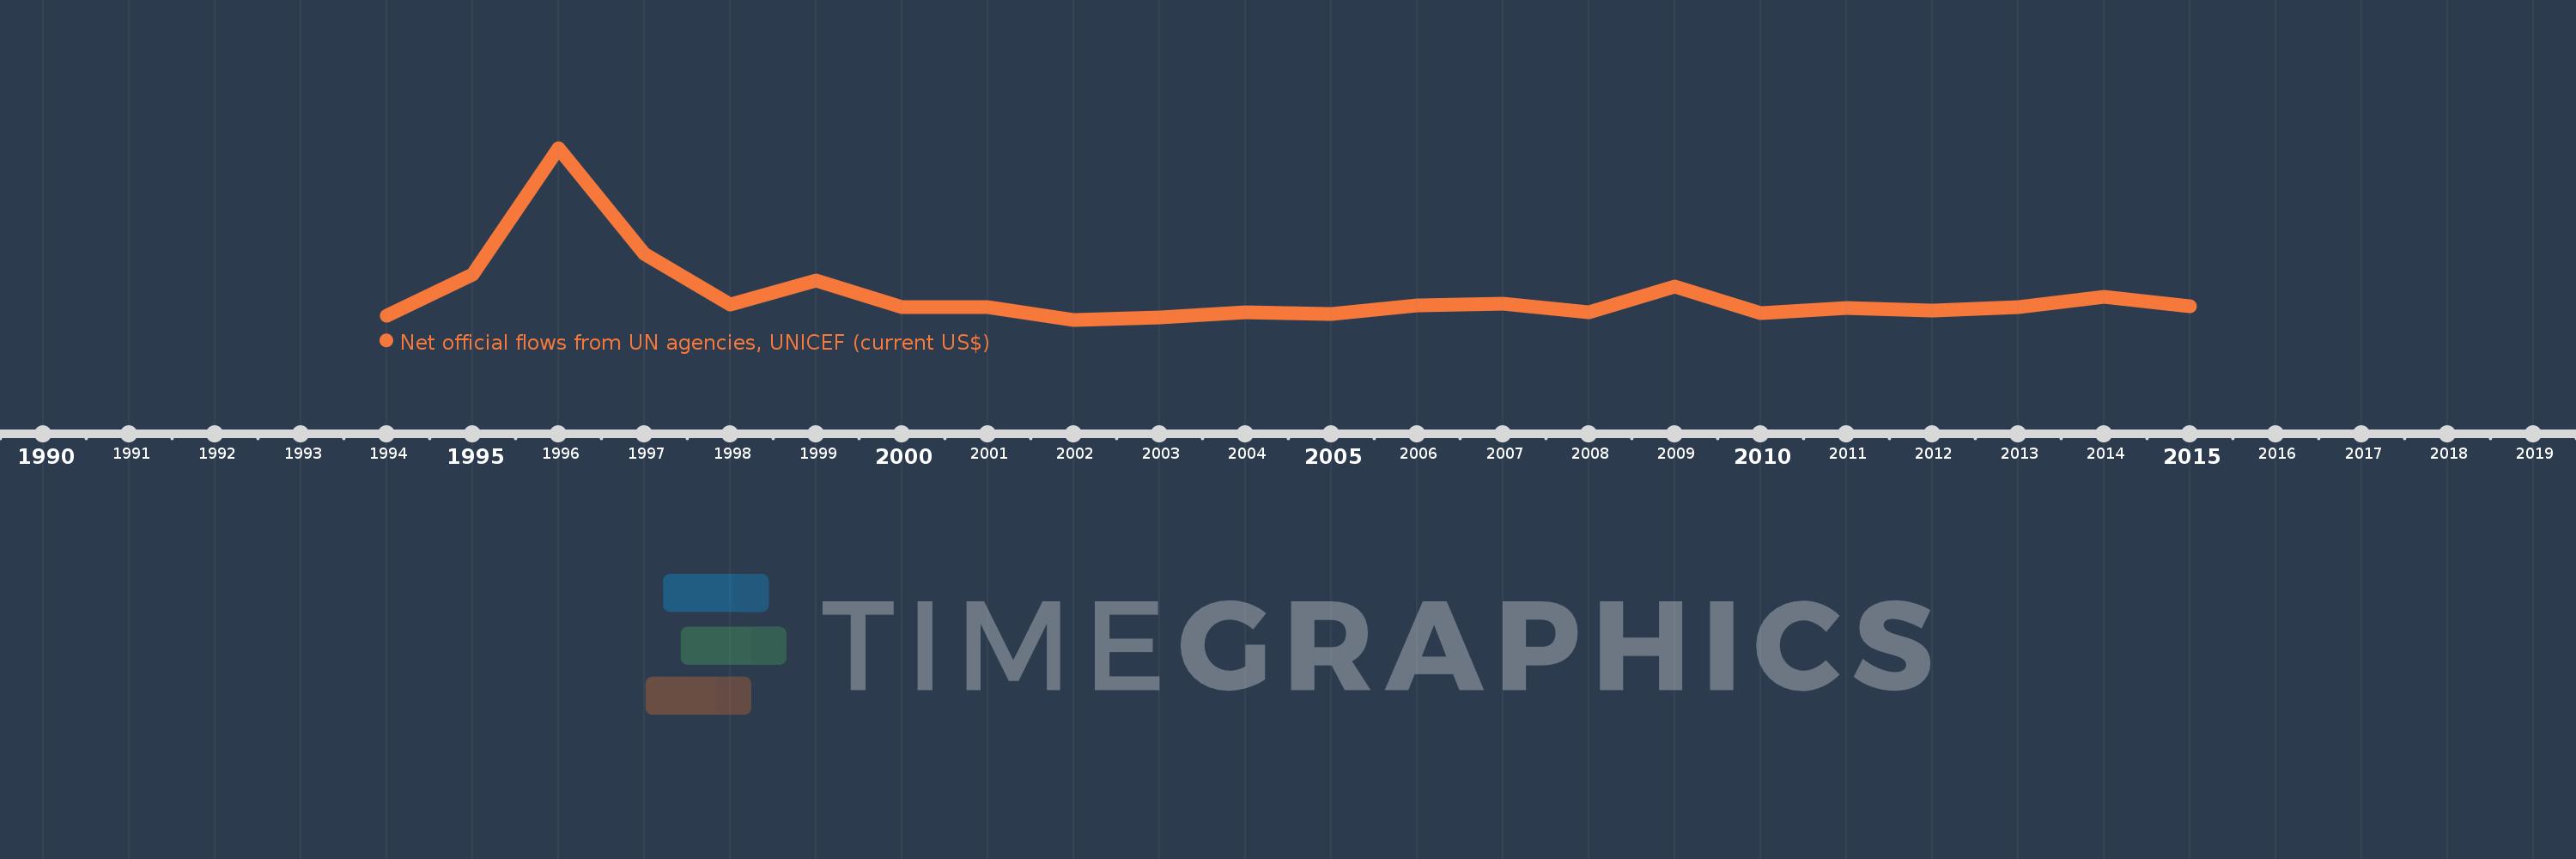
This timeline shows a graph from 1994 to 2015 of Georgia. No data until 1993. Number of actual observations by date: 22.
Source name:
World Development Indicators
Source organization:
Development Assistance Committee of the Organisation for Economic Co-operation and Development, Geographical Distribution of Financial Flows to Developing Countries, Development Co-operation Report, and International Development Statistics database. Data are available online at: www.oecd.org/dac/stats/idsonline.
Categories, topics:
Aid Effectiveness
Last updated:
apr 23, 2017
Indicators value changes by year
Meaning:
1.127 mln
Minimum:
600.0K
jan 1, 2002
Maximum:
4.36 mln
jan 1, 1996
At the date of observation
Value
Absolute change
Change from the previous value
jan 1, 1994
680.0K
+680.0K
0.0%
jan 1, 1995
1.59 mln
+910.0K
133.82%
jan 1, 1996
4.36 mln
+2.77 mln
174.21%
jan 1, 1997
2.05 mln
-2.31 mln
-52.98%
jan 1, 1998
940.0K
-1.11 mln
-54.15%
jan 1, 1999
1.46 mln
+520.0K
55.32%
jan 1, 2000
880.0K
-580.0K
-39.73%
jan 1, 2001
870.0K
-10.0K
-1.14%
jan 1, 2002
600.0K
-270.0K
-31.03%
jan 1, 2003
650.0K
+50.0K
8.33%
jan 1, 2004
760.0K
+110.0K
16.92%
jan 1, 2005
730.0K
-30.0K
-3.95%
jan 1, 2006
910.0K
+180.0K
24.66%
jan 1, 2007
950.0K
+40.0K
4.4%
jan 1, 2008
770.0K
-180.0K
-18.95%
jan 1, 2009
1.32 mln
+550.0K
71.43%
jan 1, 2010
750.0K
-570.0K
-43.18%
jan 1, 2011
850.0K
+100.0K
13.33%
jan 1, 2012
800.0K
-50.0K
-5.88%
jan 1, 2013
870.0K
+70.0K
8.75%
jan 1, 2014
1.1 mln
+230.0K
26.44%
jan 1, 2015
900.0K
-200.0K
-18.18%
Ranking of countries by current statistics by years