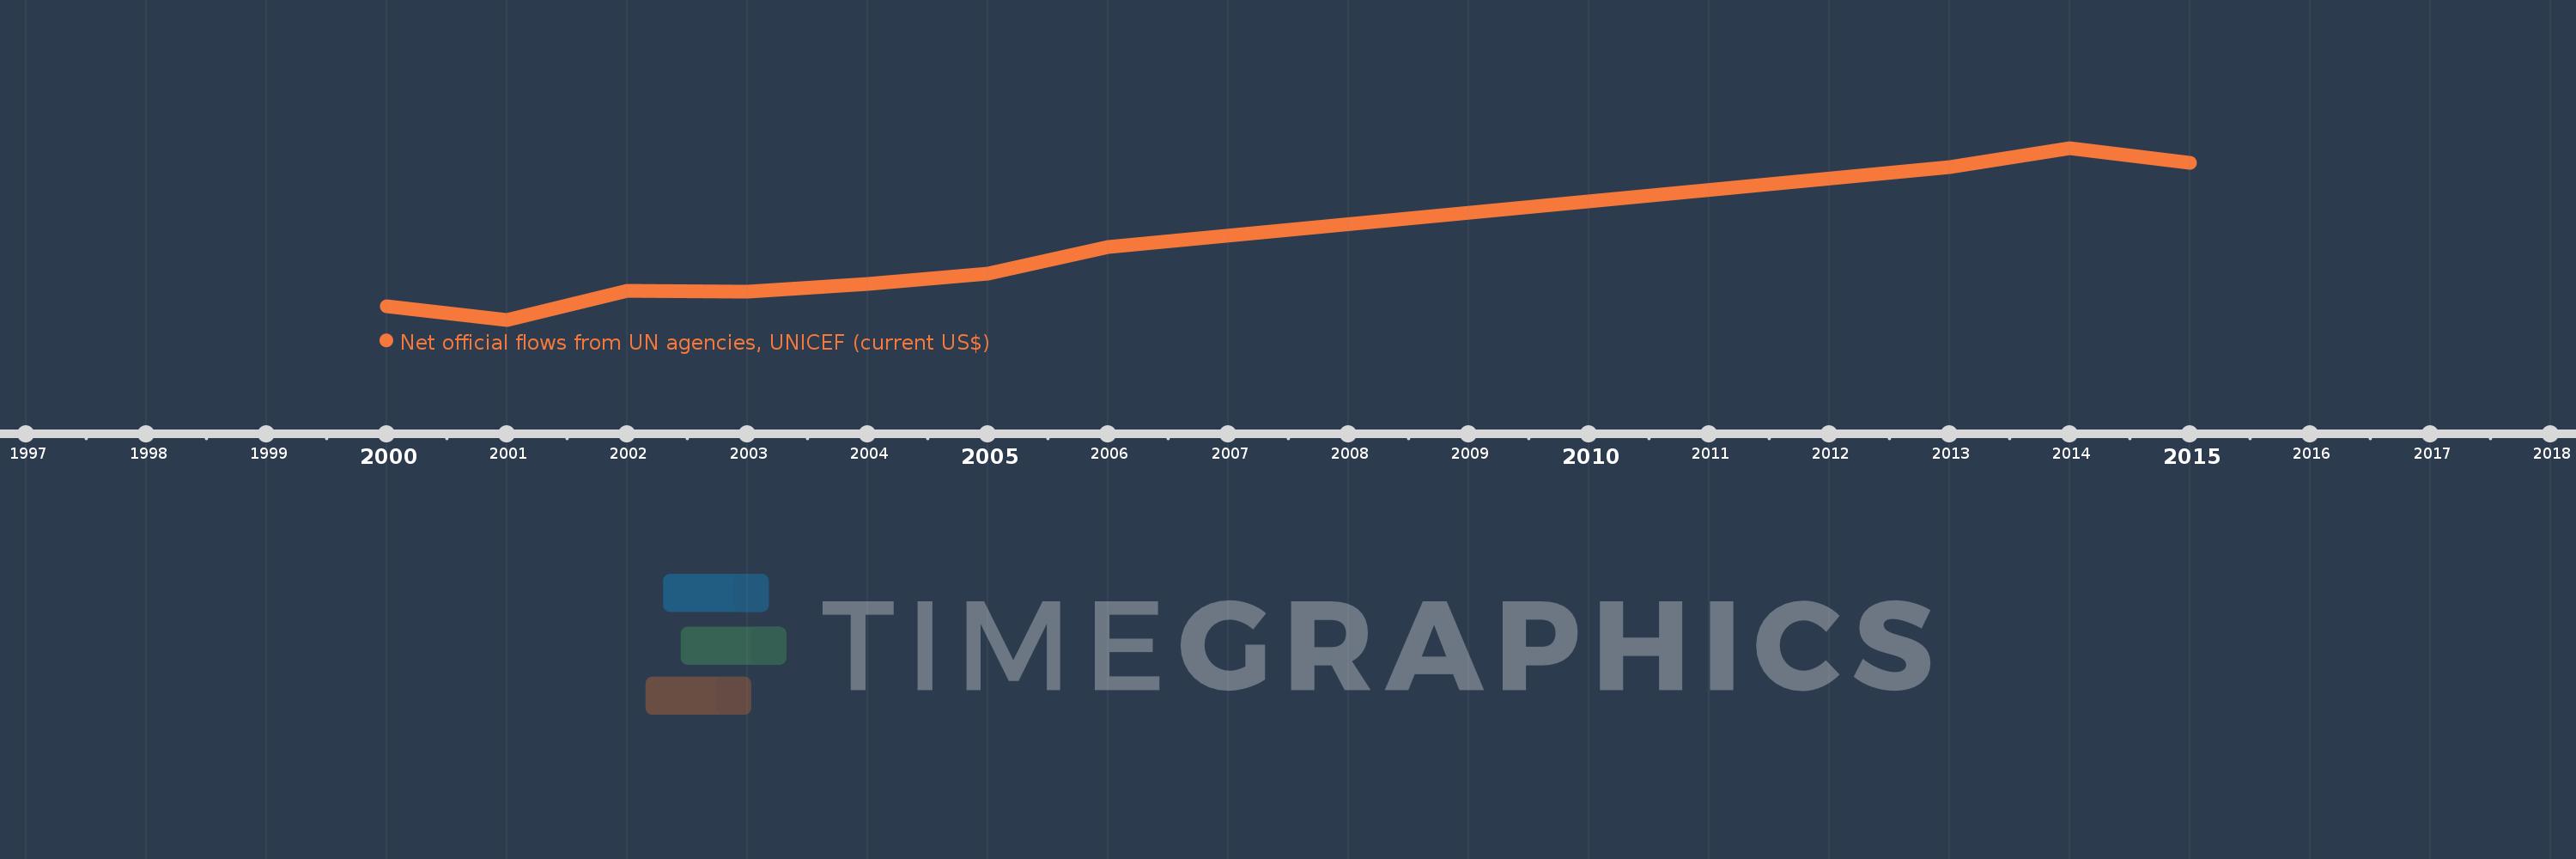
This timeline shows a graph from 2000 to 2015 of Fiji. No data until 1999. Number of actual observations by date: 10.
Source name:
World Development Indicators
Source organization:
Development Assistance Committee of the Organisation for Economic Co-operation and Development, Geographical Distribution of Financial Flows to Developing Countries, Development Co-operation Report, and International Development Statistics database. Data are available online at: www.oecd.org/dac/stats/idsonline.
Categories, topics:
Aid Effectiveness
Last updated:
apr 23, 2017
Indicators value changes by year
Meaning:
2.972 mln
Minimum:
1.02 mln
jan 1, 2001
Maximum:
5.76 mln
jan 1, 2014
At the date of observation
Value
Absolute change
Change from the previous value
jan 1, 2000
1.39 mln
+1.39 mln
0.0%
jan 1, 2001
1.02 mln
-370.0K
-26.62%
jan 1, 2002
1.82 mln
+800.0K
78.43%
jan 1, 2003
1.8 mln
-20.0K
-1.1%
jan 1, 2004
2.02 mln
+220.0K
12.22%
jan 1, 2005
2.29 mln
+270.0K
13.37%
jan 1, 2006
3.02 mln
+730.0K
31.88%
jan 1, 2013
5.24 mln
+2.22 mln
73.51%
jan 1, 2014
5.76 mln
+520.0K
9.92%
jan 1, 2015
5.36 mln
-400.0K
-6.94%
Ranking of countries by current statistics by years