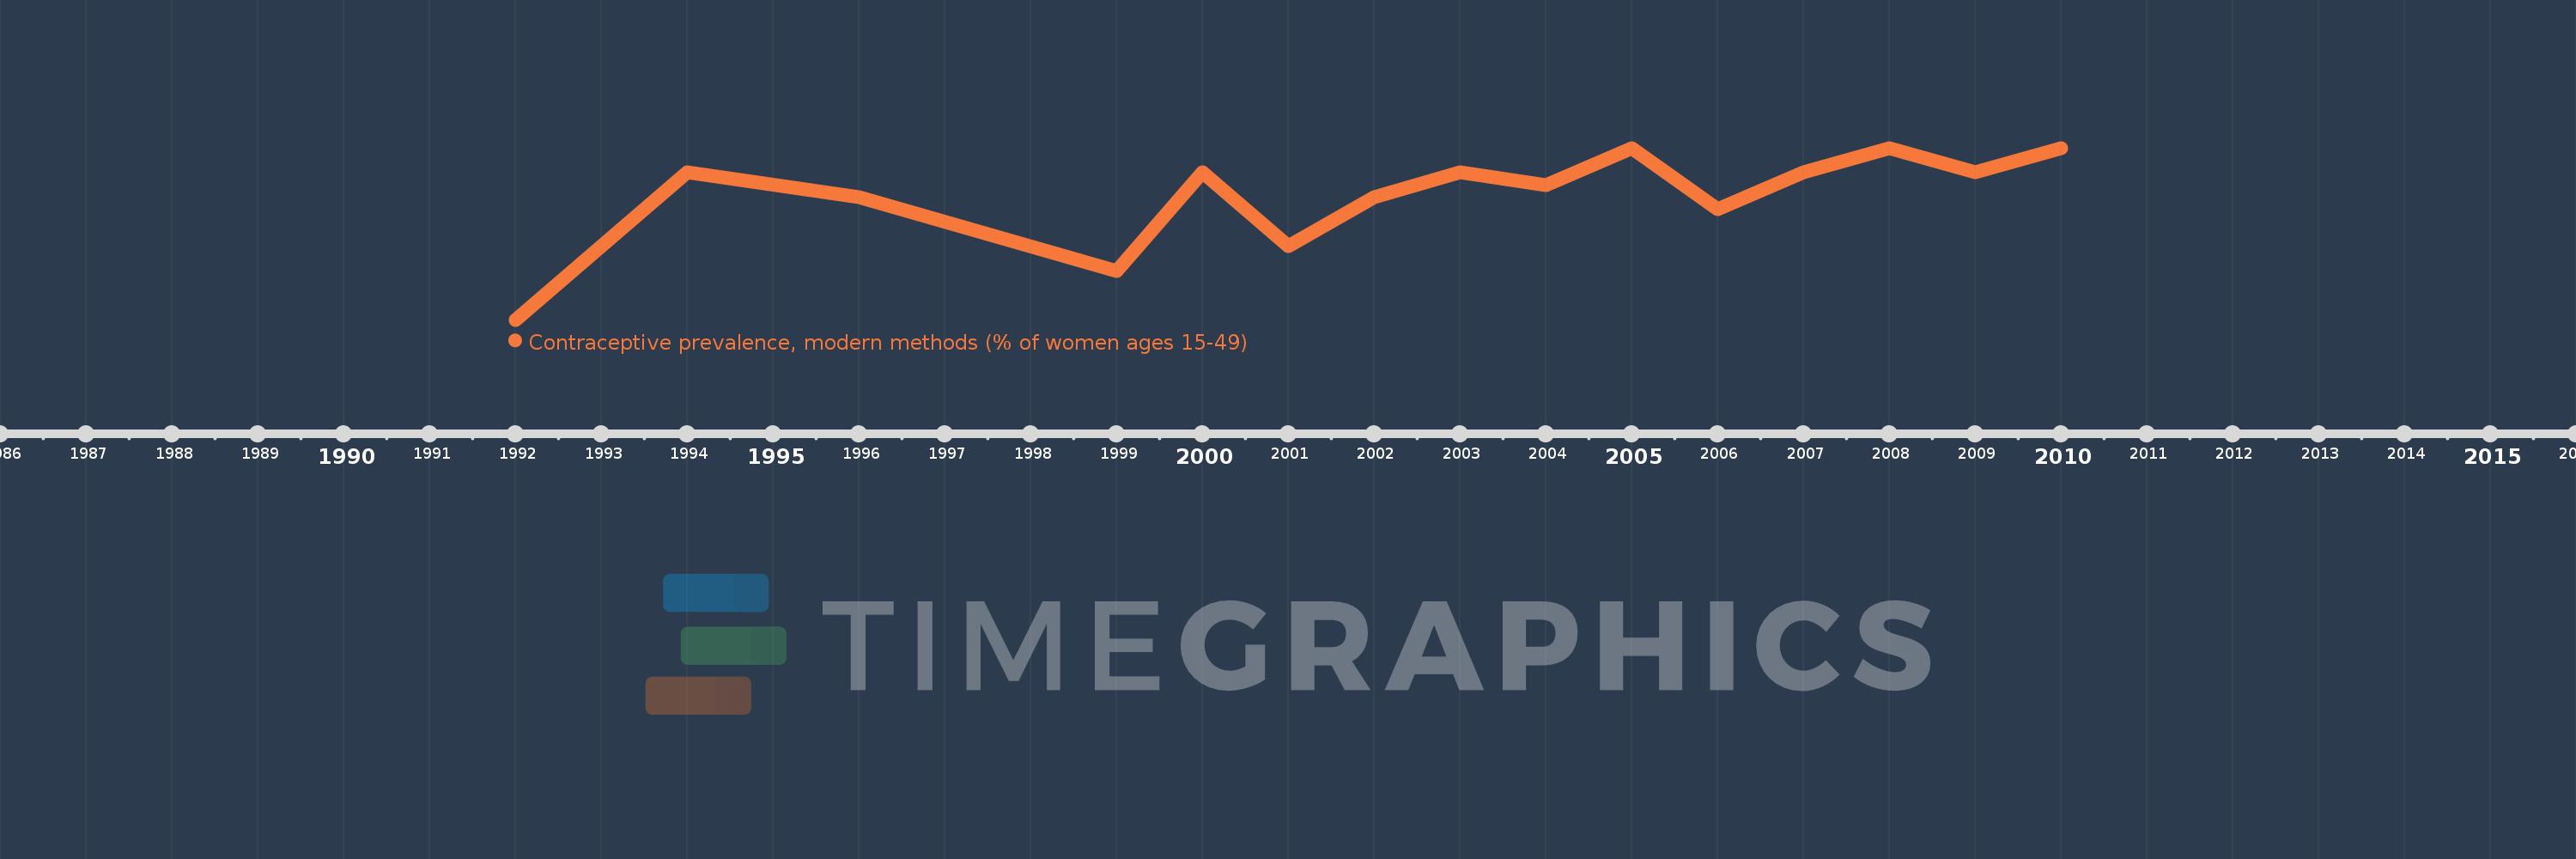
This timeline shows a graph from 1992 to 2010 of United Kingdom. No data until 1991. Number of actual observations by date: 15.
Source name:
World Development Indicators
Source organization:
Household surveys, including Demographic and Health Surveys and Multiple Indicator Cluster Surveys. Largely compiled by United Nations Population Division.
Categories, topics:
Health
Last updated:
apr 23, 2017
Indicators value changes by year
Meaning:
80.133
Minimum:
70.0
jan 1, 1992
Maximum:
84.0
jan 1, 2005
At the date of observation
Value
Absolute change
Change from the previous value
jan 1, 1992
70.0
+70.0
0.0%
jan 1, 1994
82.0
+12.0
17.14%
jan 1, 1996
80.0
-2.0
-2.44%
jan 1, 1999
74.0
-6.0
-7.5%
jan 1, 2000
82.0
+8.0
10.81%
jan 1, 2001
76.0
-6.0
-7.32%
jan 1, 2002
80.0
+4.0
5.26%
jan 1, 2003
82.0
+2.0
2.5%
jan 1, 2004
81.0
-1.0
-1.22%
jan 1, 2005
84.0
+3.0
3.7%
jan 1, 2006
79.0
-5.0
-5.95%
jan 1, 2007
82.0
+3.0
3.8%
jan 1, 2008
84.0
+2.0
2.44%
jan 1, 2009
82.0
-2.0
-2.38%
jan 1, 2010
84.0
+2.0
2.44%
Ranking of countries by current statistics by years