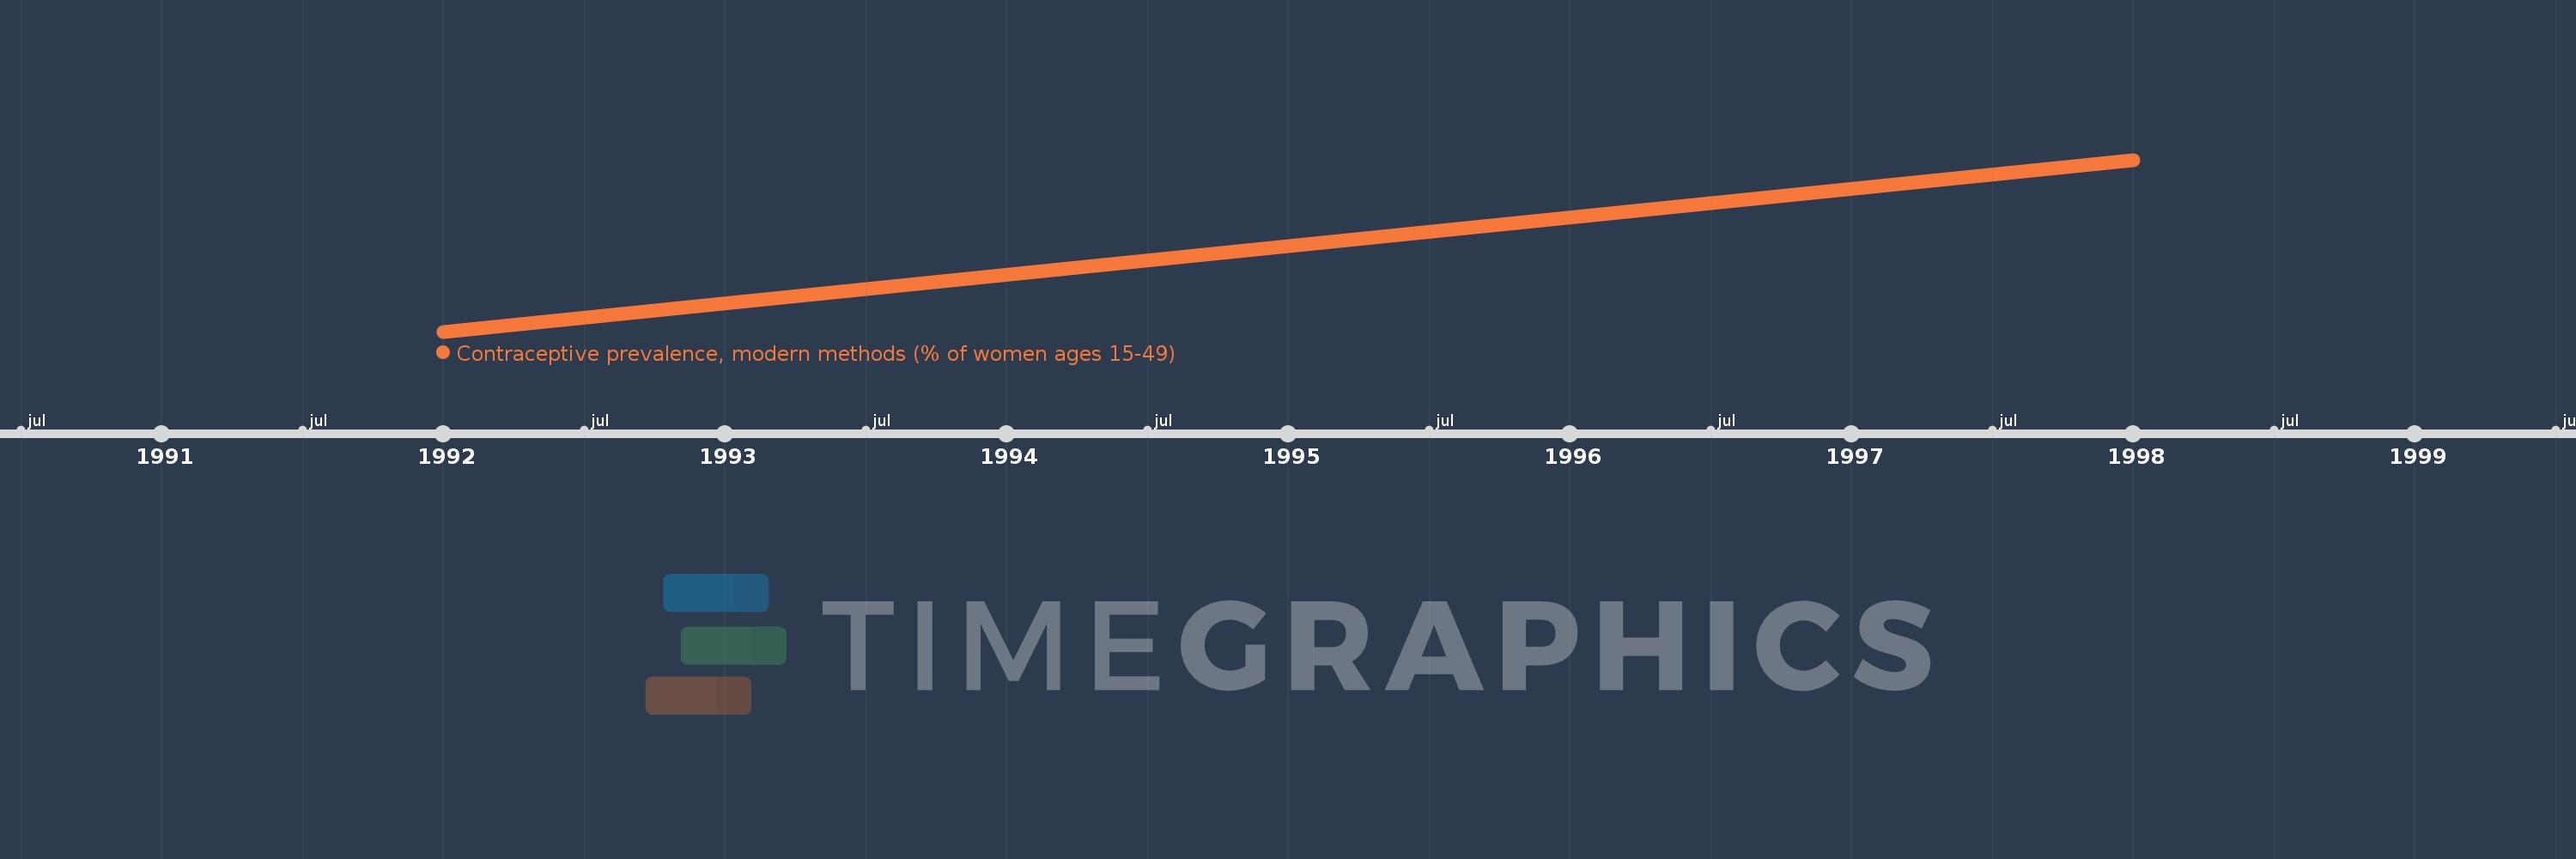
This timeline shows a graph from 1992 to 1998 of Slovak Republic. No data until 1991. Number of actual observations by date: 2.
Source name:
World Development Indicators
Source organization:
Household surveys, including Demographic and Health Surveys and Multiple Indicator Cluster Surveys. Largely compiled by United Nations Population Division.
Categories, topics:
Health
Last updated:
apr 23, 2017
Indicators value changes by year
Meaning:
53.3
Minimum:
41.0
jan 1, 1992
Maximum:
65.6
jan 1, 1998
At the date of observation
Value
Absolute change
Change from the previous value
jan 1, 1992
41.0
+41.0
0.0%
jan 1, 1998
65.6
+24.6
60.0%
Ranking of countries by current statistics by years