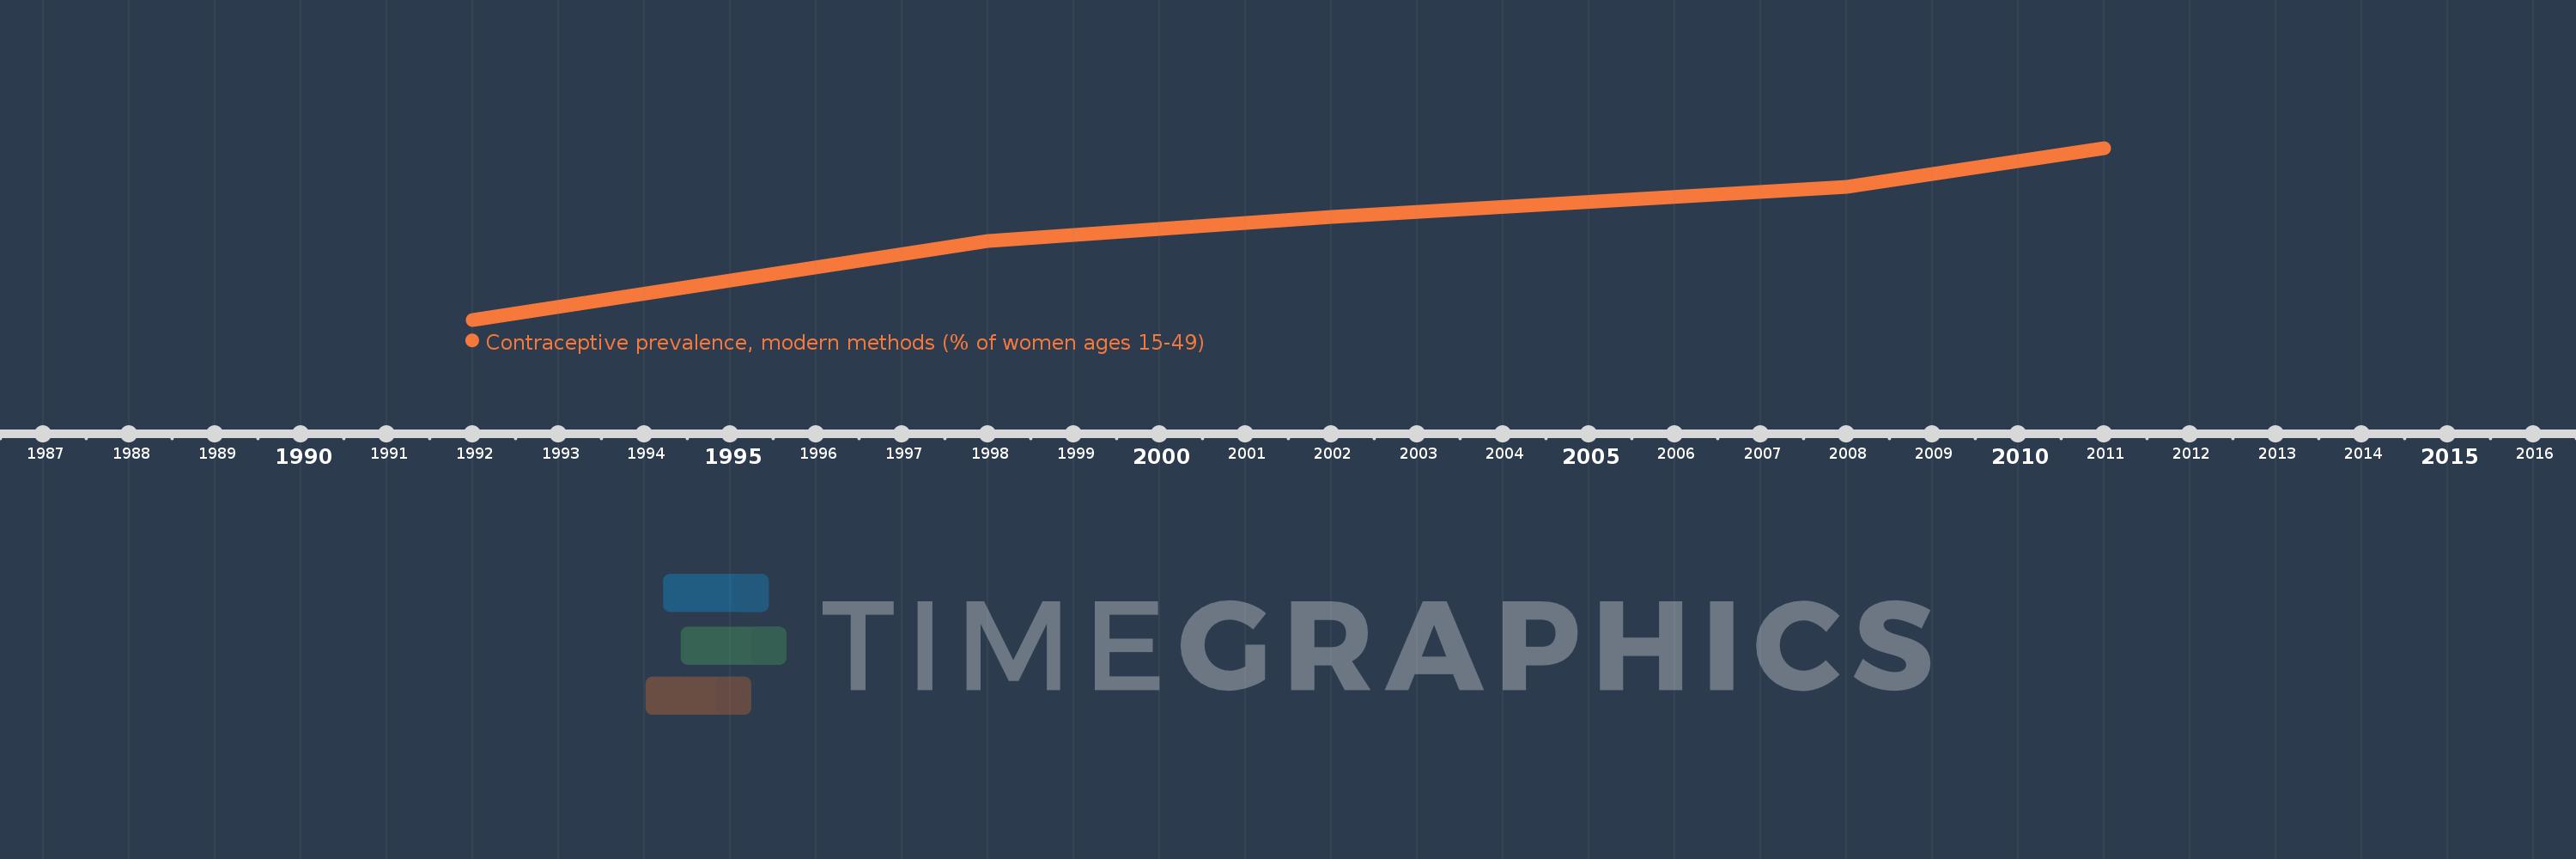
This timeline shows a graph from 1992 to 2011 of Myanmar. No data until 1991. Number of actual observations by date: 5.
Source name:
World Development Indicators
Source organization:
Household surveys, including Demographic and Health Surveys and Multiple Indicator Cluster Surveys. Largely compiled by United Nations Population Division.
Categories, topics:
Health
Last updated:
apr 23, 2017
Indicators value changes by year
Meaning:
31.76
Minimum:
13.6
jan 1, 1992
Maximum:
45.7
jan 1, 2011
At the date of observation
Value
Absolute change
Change from the previous value
jan 1, 1992
13.6
+13.6
0.0%
jan 1, 1998
28.3
+14.7
108.09%
jan 1, 2002
32.8
+4.5
15.9%
jan 1, 2008
38.4
+5.6
17.07%
jan 1, 2011
45.7
+7.3
19.01%
Ranking of countries by current statistics by years